Back chapter figures
Figure 7.4
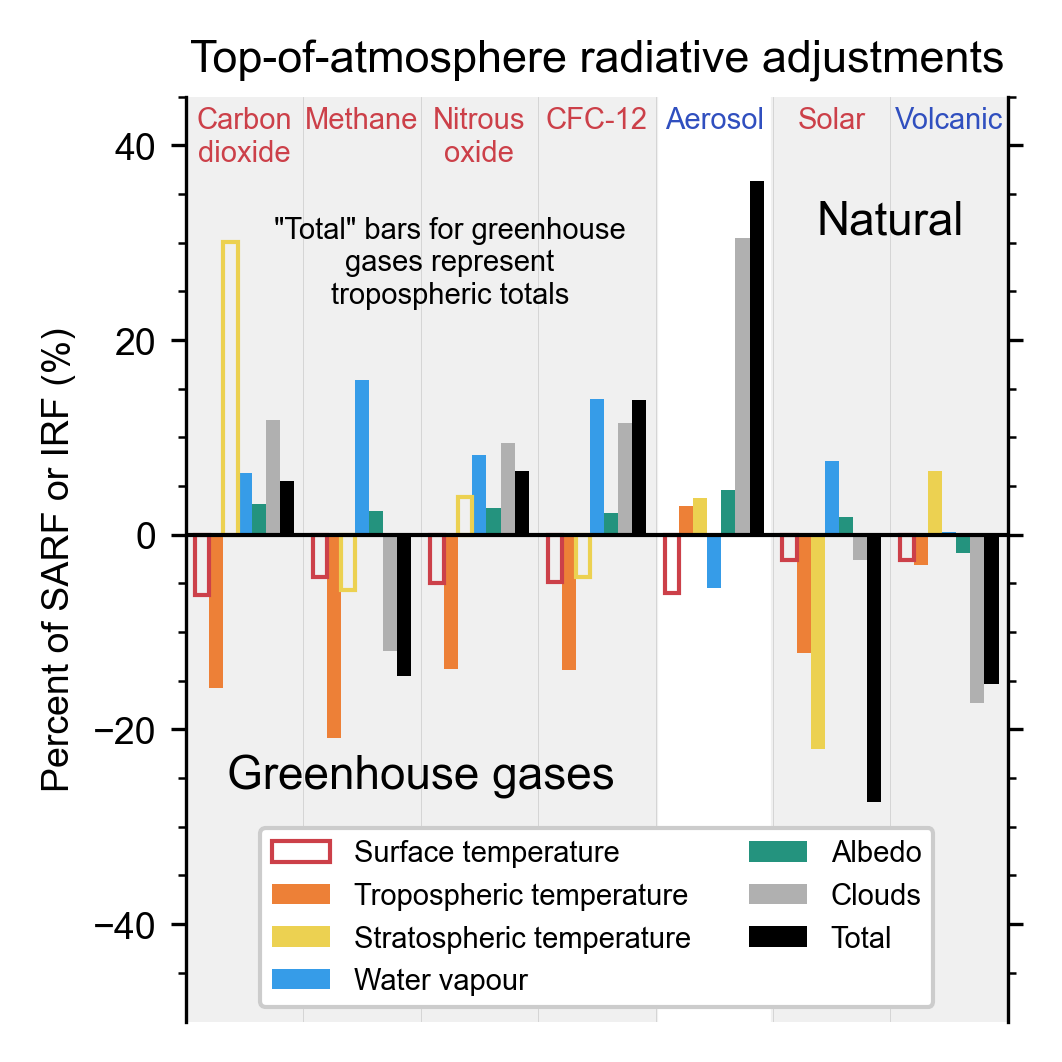
Figure caption
Figure 7.4 | Radiative adjustments at top of atmosphere for seven different climate drivers as a proportion of forcing. Tropospheric temperature (orange), stratospheric temperature (yellow), water vapour (blue), surface albedo (green), clouds (grey) and the total adjustment (black) is shown. For the greenhouse gases (carbon dioxide, methane, nitrous oxide and CFC-12) the adjustments are expressed as a percentage of stratospheric-temperature-adjusted radiative forcing (SARF), whereas for aerosol, solar and volcanic forcing they are expressed as a percentage of instantaneous radiative forcing (IRF). Land surface temperature response (outline red bar) is shown, but included in the definition of forcing. Data from Smith et al. (2018b) for carbon dioxide and methane; Smith et al. (2018b) and Gray et al. (2009) for solar; Hodnebrog et al. (2020b) for nitrous oxide and CFC-12; Smith et al. (2020b) for aerosol, and Marshall et al. (2020) for volcanic. Further details on data sources and processing are available in the chapter data table (Table 7.SM.14).