Back chapter figures
Figure 7.5
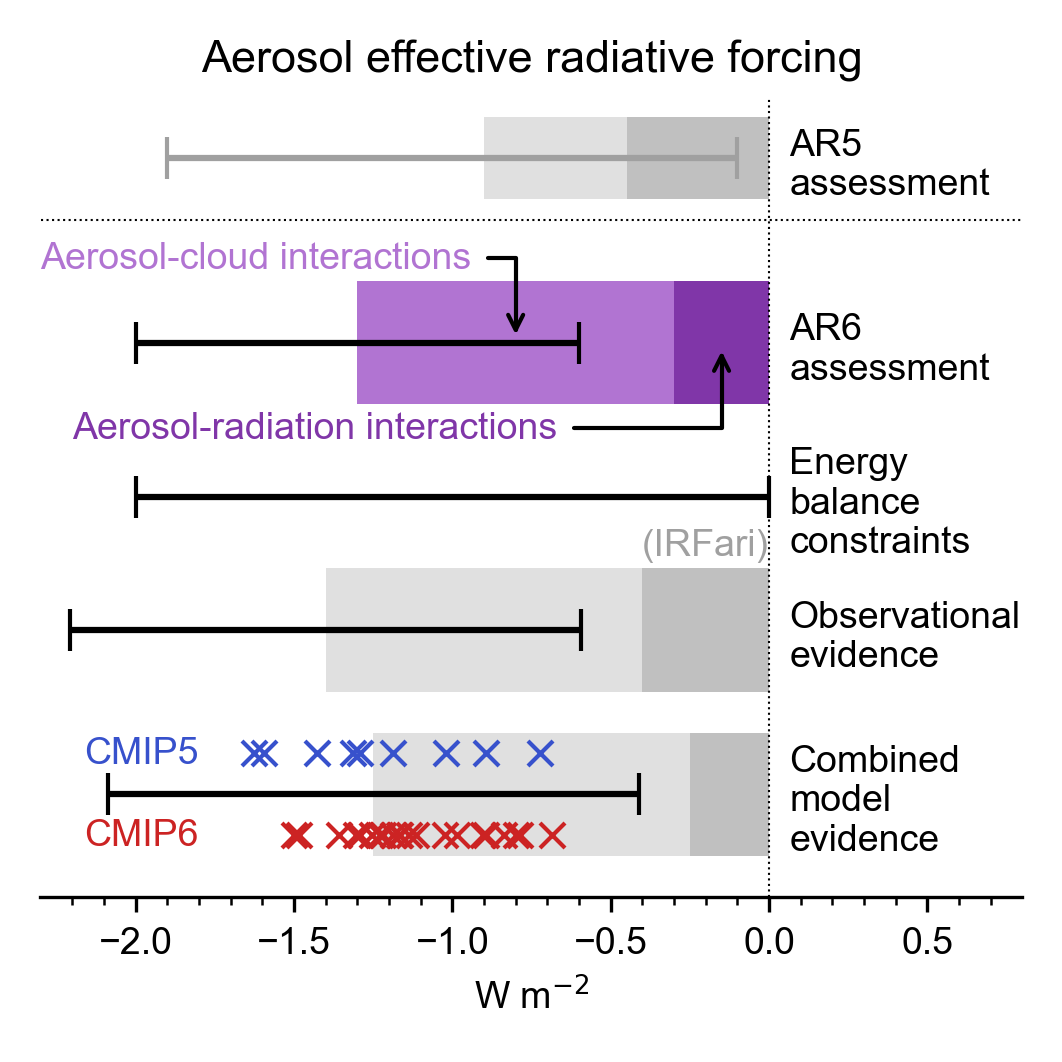
Figure caption
Figure 7.5 | Net aerosol effective radiative forcing (ERF) from different lines of evidence. The headline AR6 assessment of –1.3 [–2.0 to –0.6] W m–2 is highlighted in purple for 1750–2014 and compared to the AR5 assessment of –0.9 [–1.9 to –0.1] W m–2 for 1750–2011. The evidence comprising the AR6 assessment is shown below this: energy balance constraints [–2 to 0 W m–2 with no best estimate]; observational evidence from satellite retrievals of –1.4 [–2.2 to –0.6] W m–2; and climate model-based evidence of –1.25 [–2.1 to –0.4] W m–2. Estimates from individual CMIP5 (Zelinka et al., 2014) and CMIP6 (Smith et al., 2020b and Table 7.6) models are depicted by blue and red crosses respectively. For each line of evidence the assessed best-estimate contributions from ERFari and ERFaci are shown with darker and paler shading respectively. The observational assessment for ERFari is taken from the IRFari. Uncertainty ranges are represented by black bars for the total aerosol ERF and depictvery likely ranges. Further details on data sources and processing are available in the chapter data table (Table 7.SM.14).