Back chapter figures
Figure 7.8
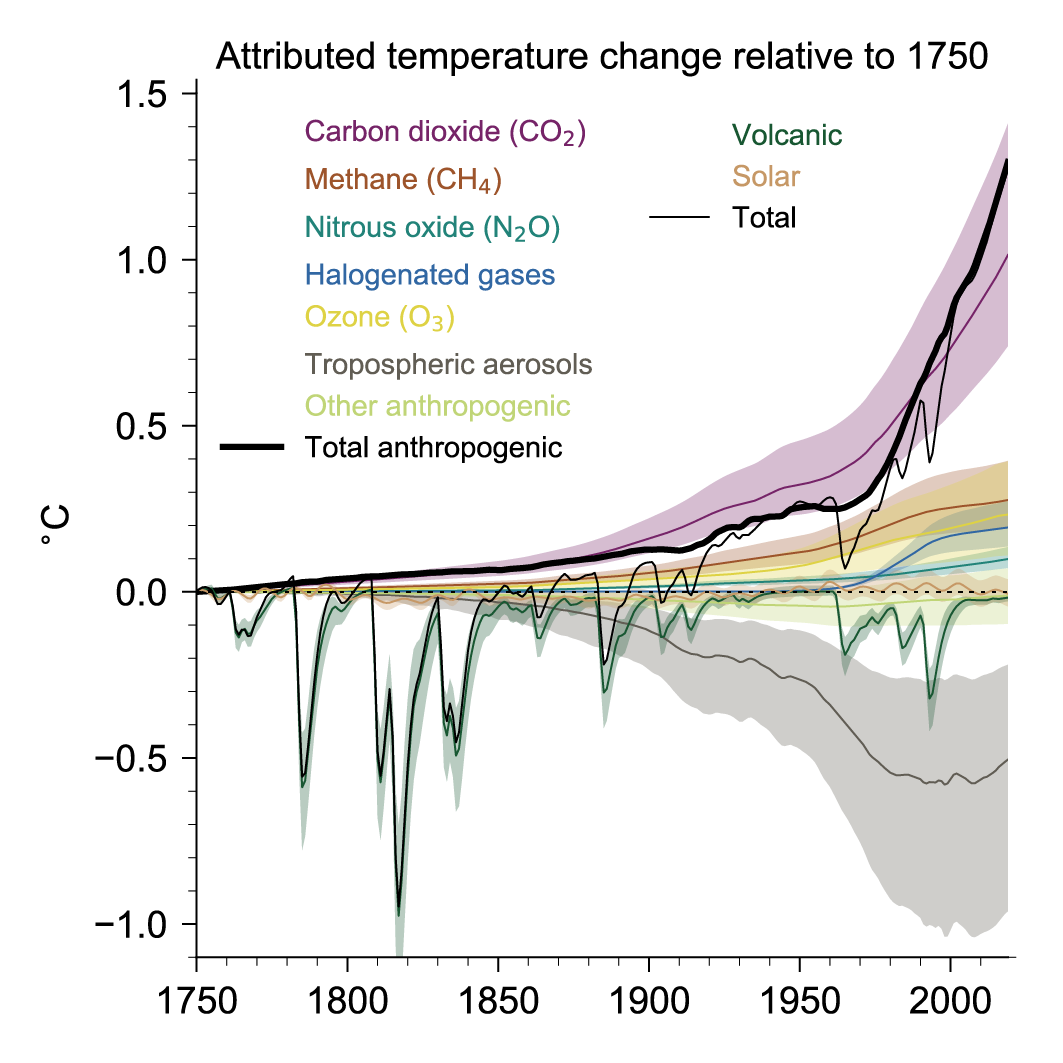
Figure caption
Figure 7.8 | Attributed global surface air temperature change (GSAT) from 1750 to 2019 produced using the two-layer emulator (Supplementary Material 7.SM.2), forced with ERF derived in this chapter (displayed in Figure 2.10) and climate response constrained to assessed ranges for key climate metrics described in Cross-Chapter Box 7.1. The results shown are the medians from a 2237-member ensemble that encompasses uncertainty in forcing and climate response (year-2019 best estimates and uncertainties are shown in Figure 7.7 for several components). Temperature contributions are expressed for carbon dioxide (CO2), methane (CH4), nitrous oxide (N2O), other well-mixed greenhouse gases (WMGHGs), ozone (O3), aerosols, and other anthropogenic forcings, as well as total anthropogenic, solar, volcanic, and total forcing. Shaded uncertainty bands showvery likely (5–95%)ranges. Further details on data sources and processing are available in the chapter data table (Table 7.SM.14).