Back chapter figures
Figure 7.9
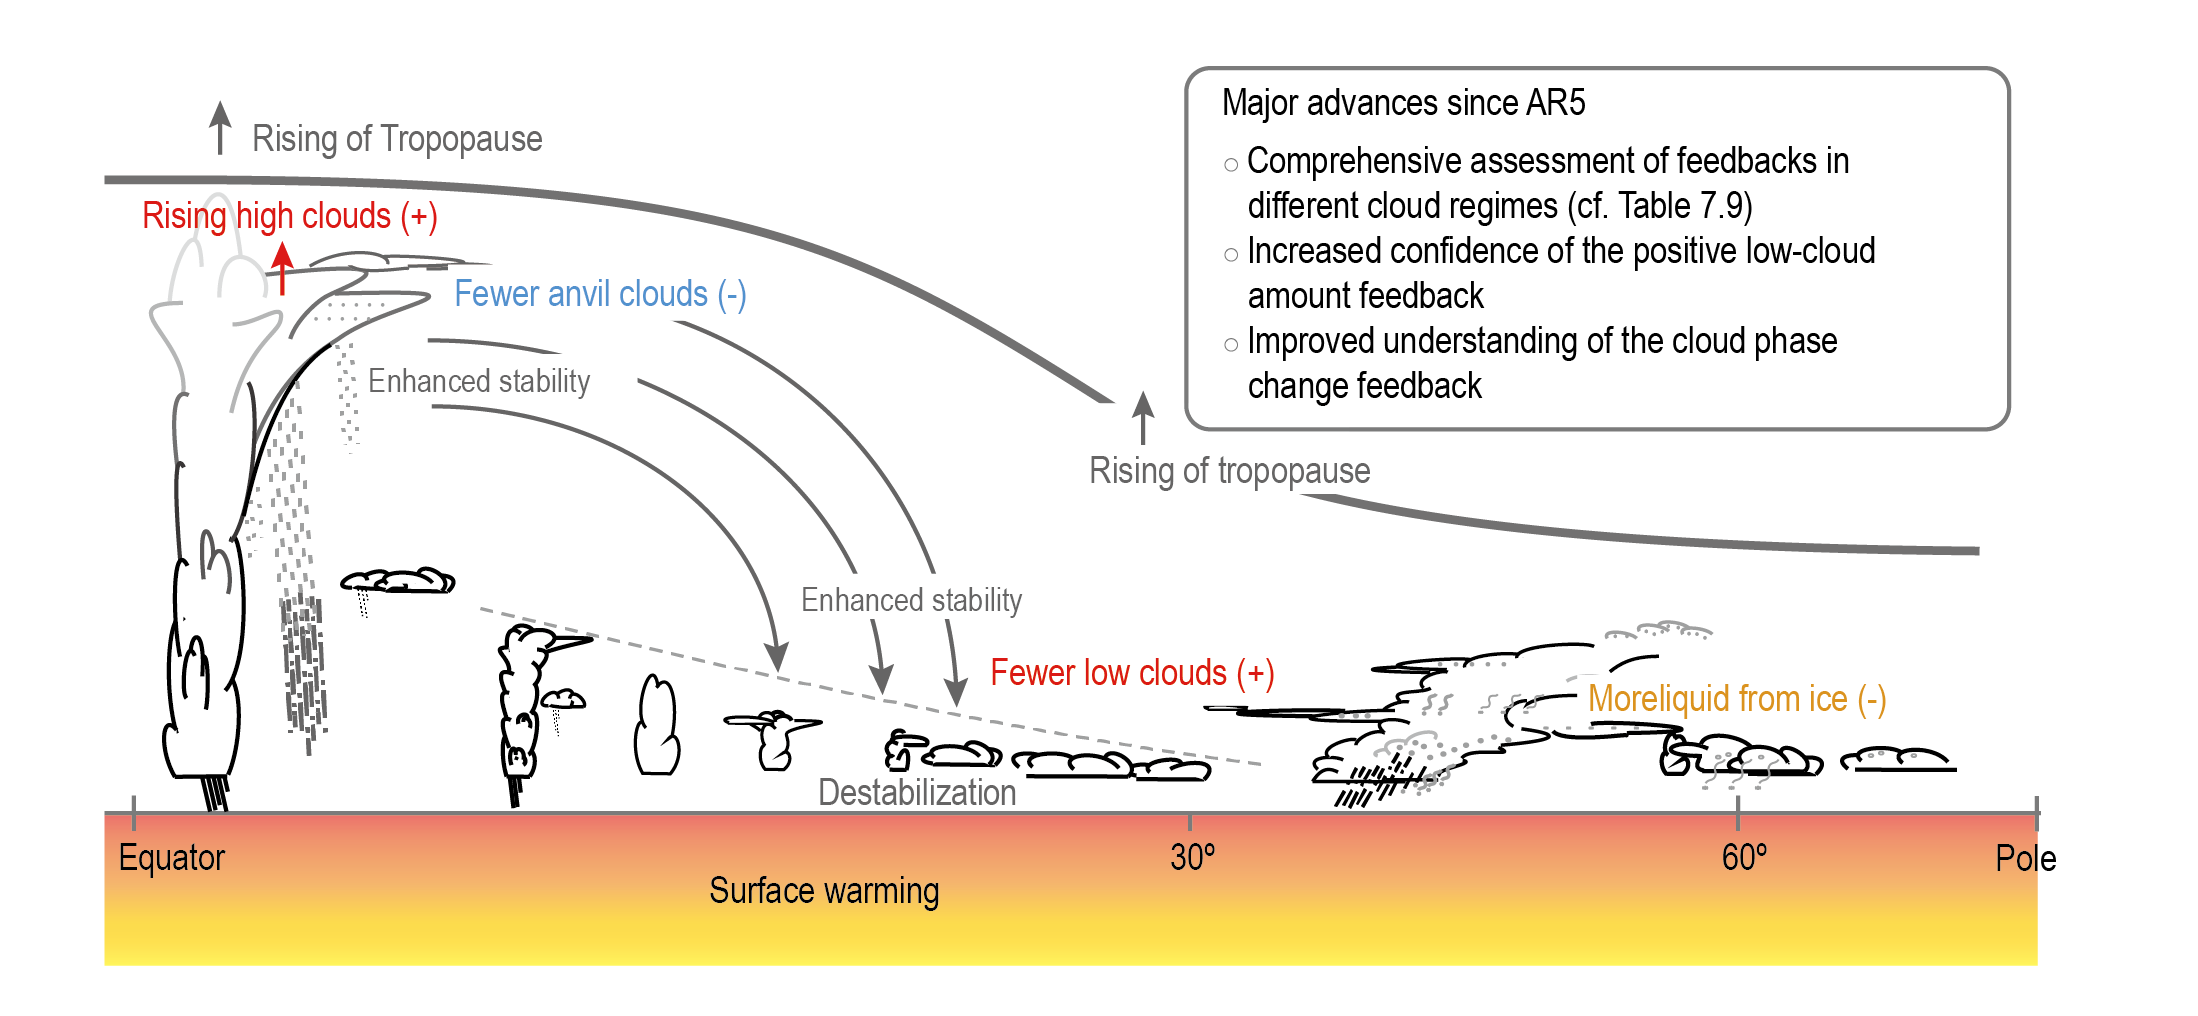
Figure caption
Figure 7.9 | Schematic cross section of diverse cloud responses to surface warming from the tropics to polar regions. Thick solid and dashed curves indicate the tropopause and the subtropical inversion layer in the current climate, respectively. Thin grey text and arrows represent robust responses in the thermodynamic structure to greenhouse warming, of relevance to cloud changes. Text and arrows in red, orange and green show the major cloud responses assessed with high, medium and low confidence, respectively, and the sign of their feedbacks to the surface warming is indicated in the parenthesis. Major advances since AR5 are listed in the box. Figure adapted from Boucher et al. (2013).