Cross-Chapter Box 8.1, Figure 1
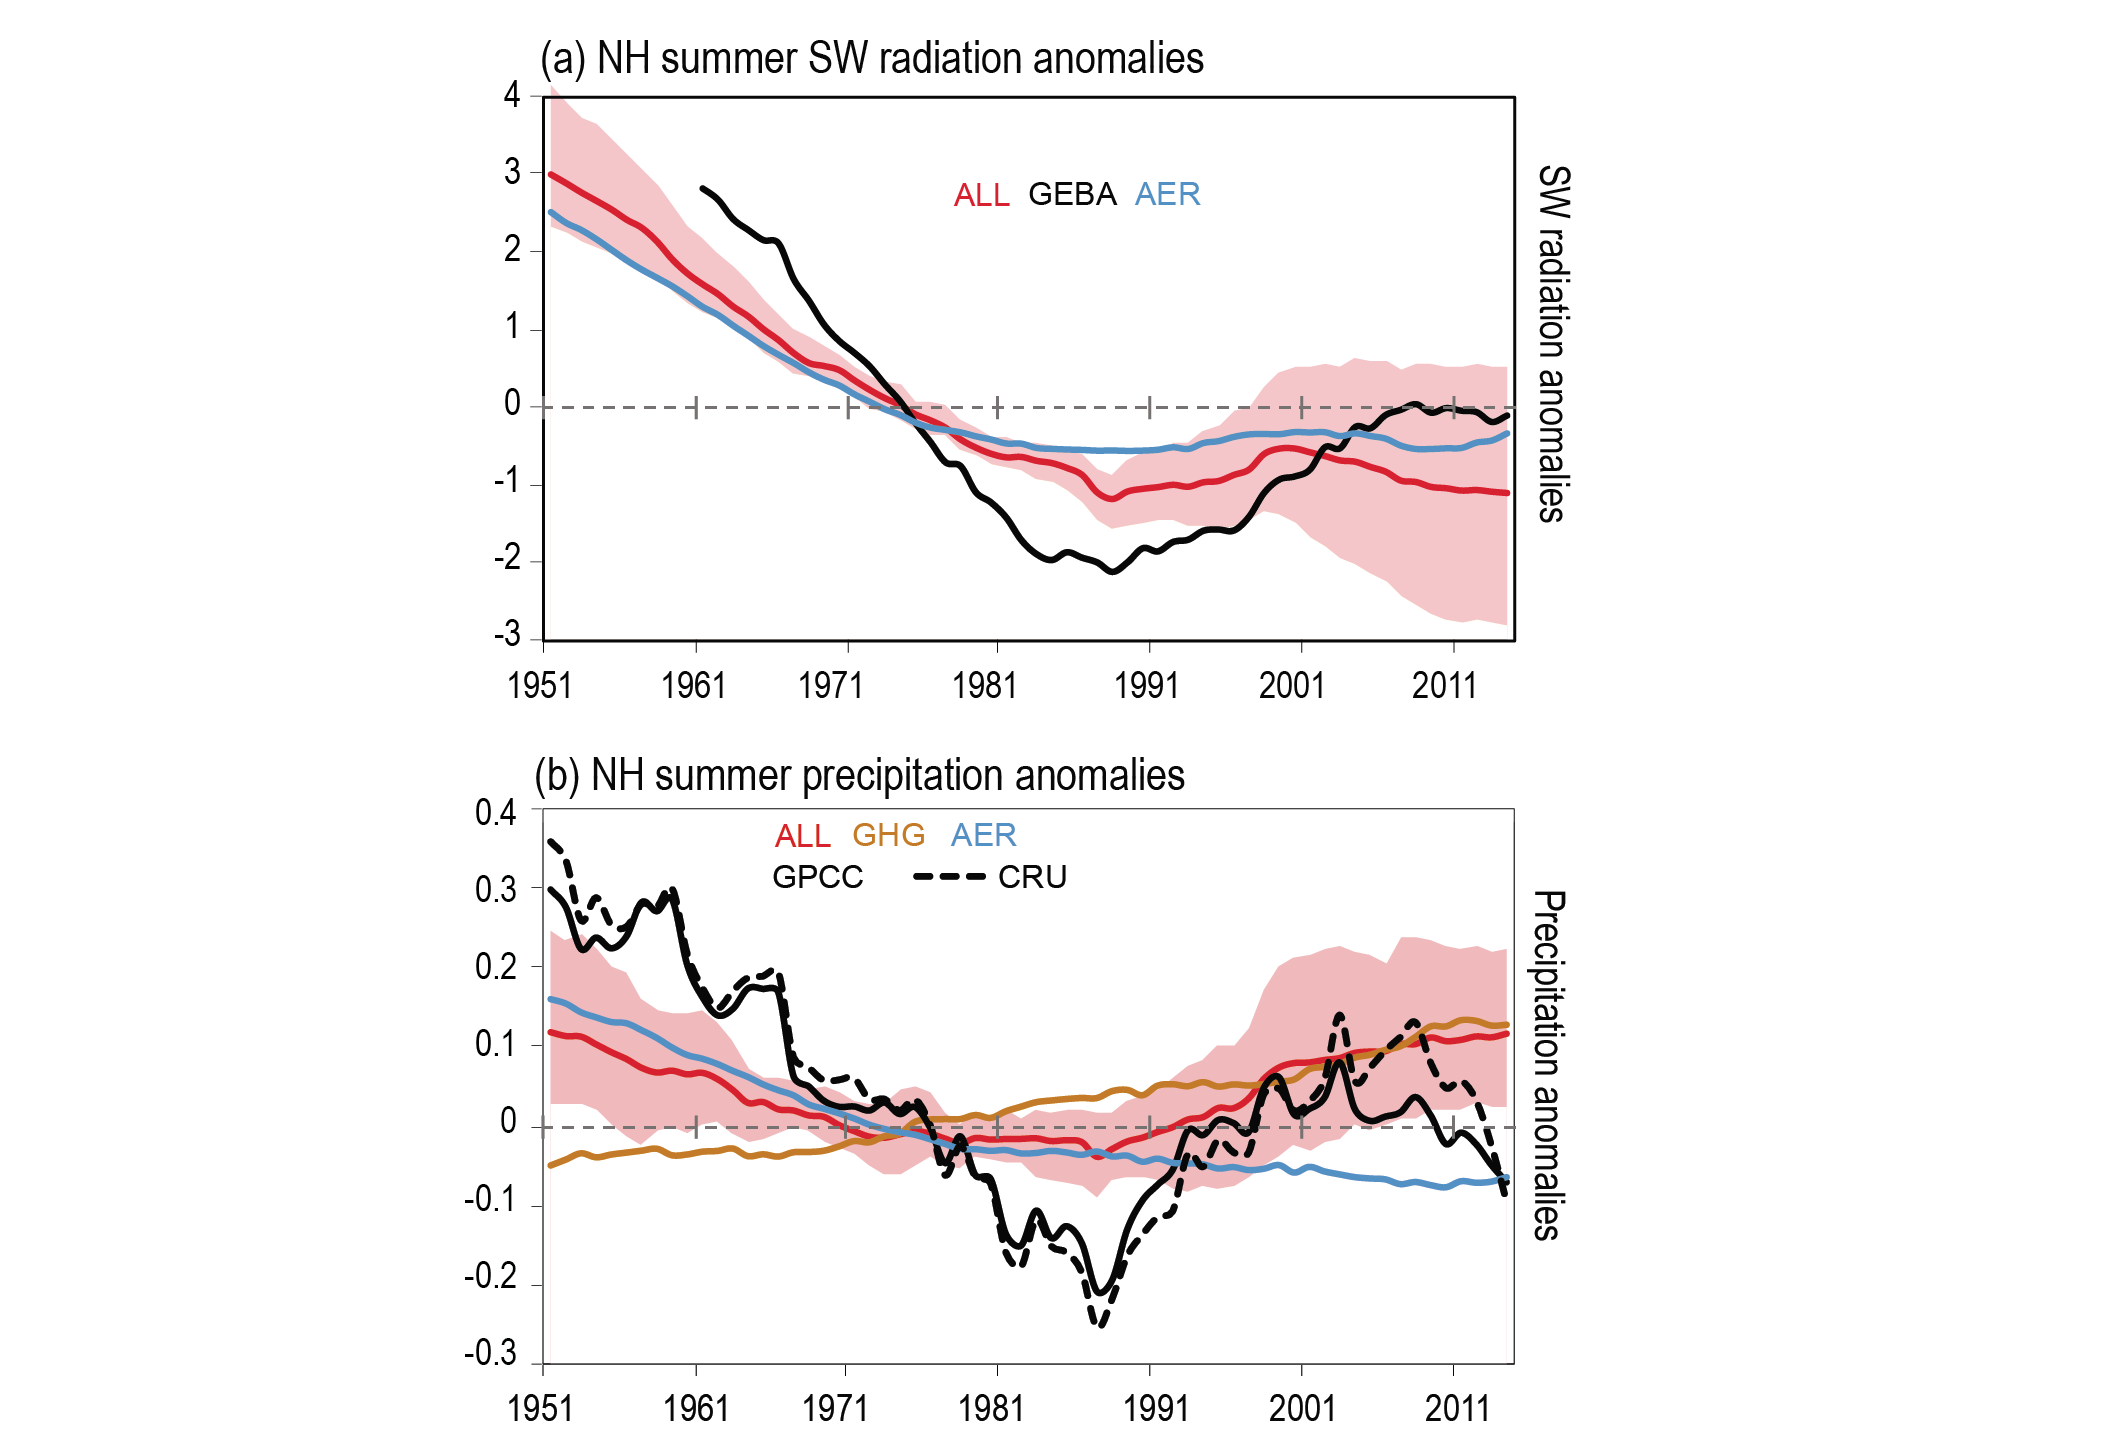
Figure caption
Box 8.1, Figure 1 | Northern Hemisphere surface downward radiation anomalies (W m–2; a) and precipitation anomalies (mm day–1; b) for1951–2014for summer season (May–September) monsoon region(Polsonet al. , 2014) from CMIP6 DAMIP experiments. Observed solar radiation anomalies are from GEBA global data from 1961–2014 (Wild et al., 2017) and observed precipitation anomalies are from GPCC and CRU. CMIP6 multi-model mean anomalies are from all-forcings (ALL), greenhouse gas forcing (GHG) and anthropogenic aerosol forcing (AER) experiments. Anomalies are with respect to 1961–1990 and smoothed with a 11-year running mean. Red shading shows the ensemble spread of ALL forcing experiment (5–95% range). Models are masked to the GPCC data set. Further details on data sources and processing are available in the chapter data table (Table 8.SM.1).