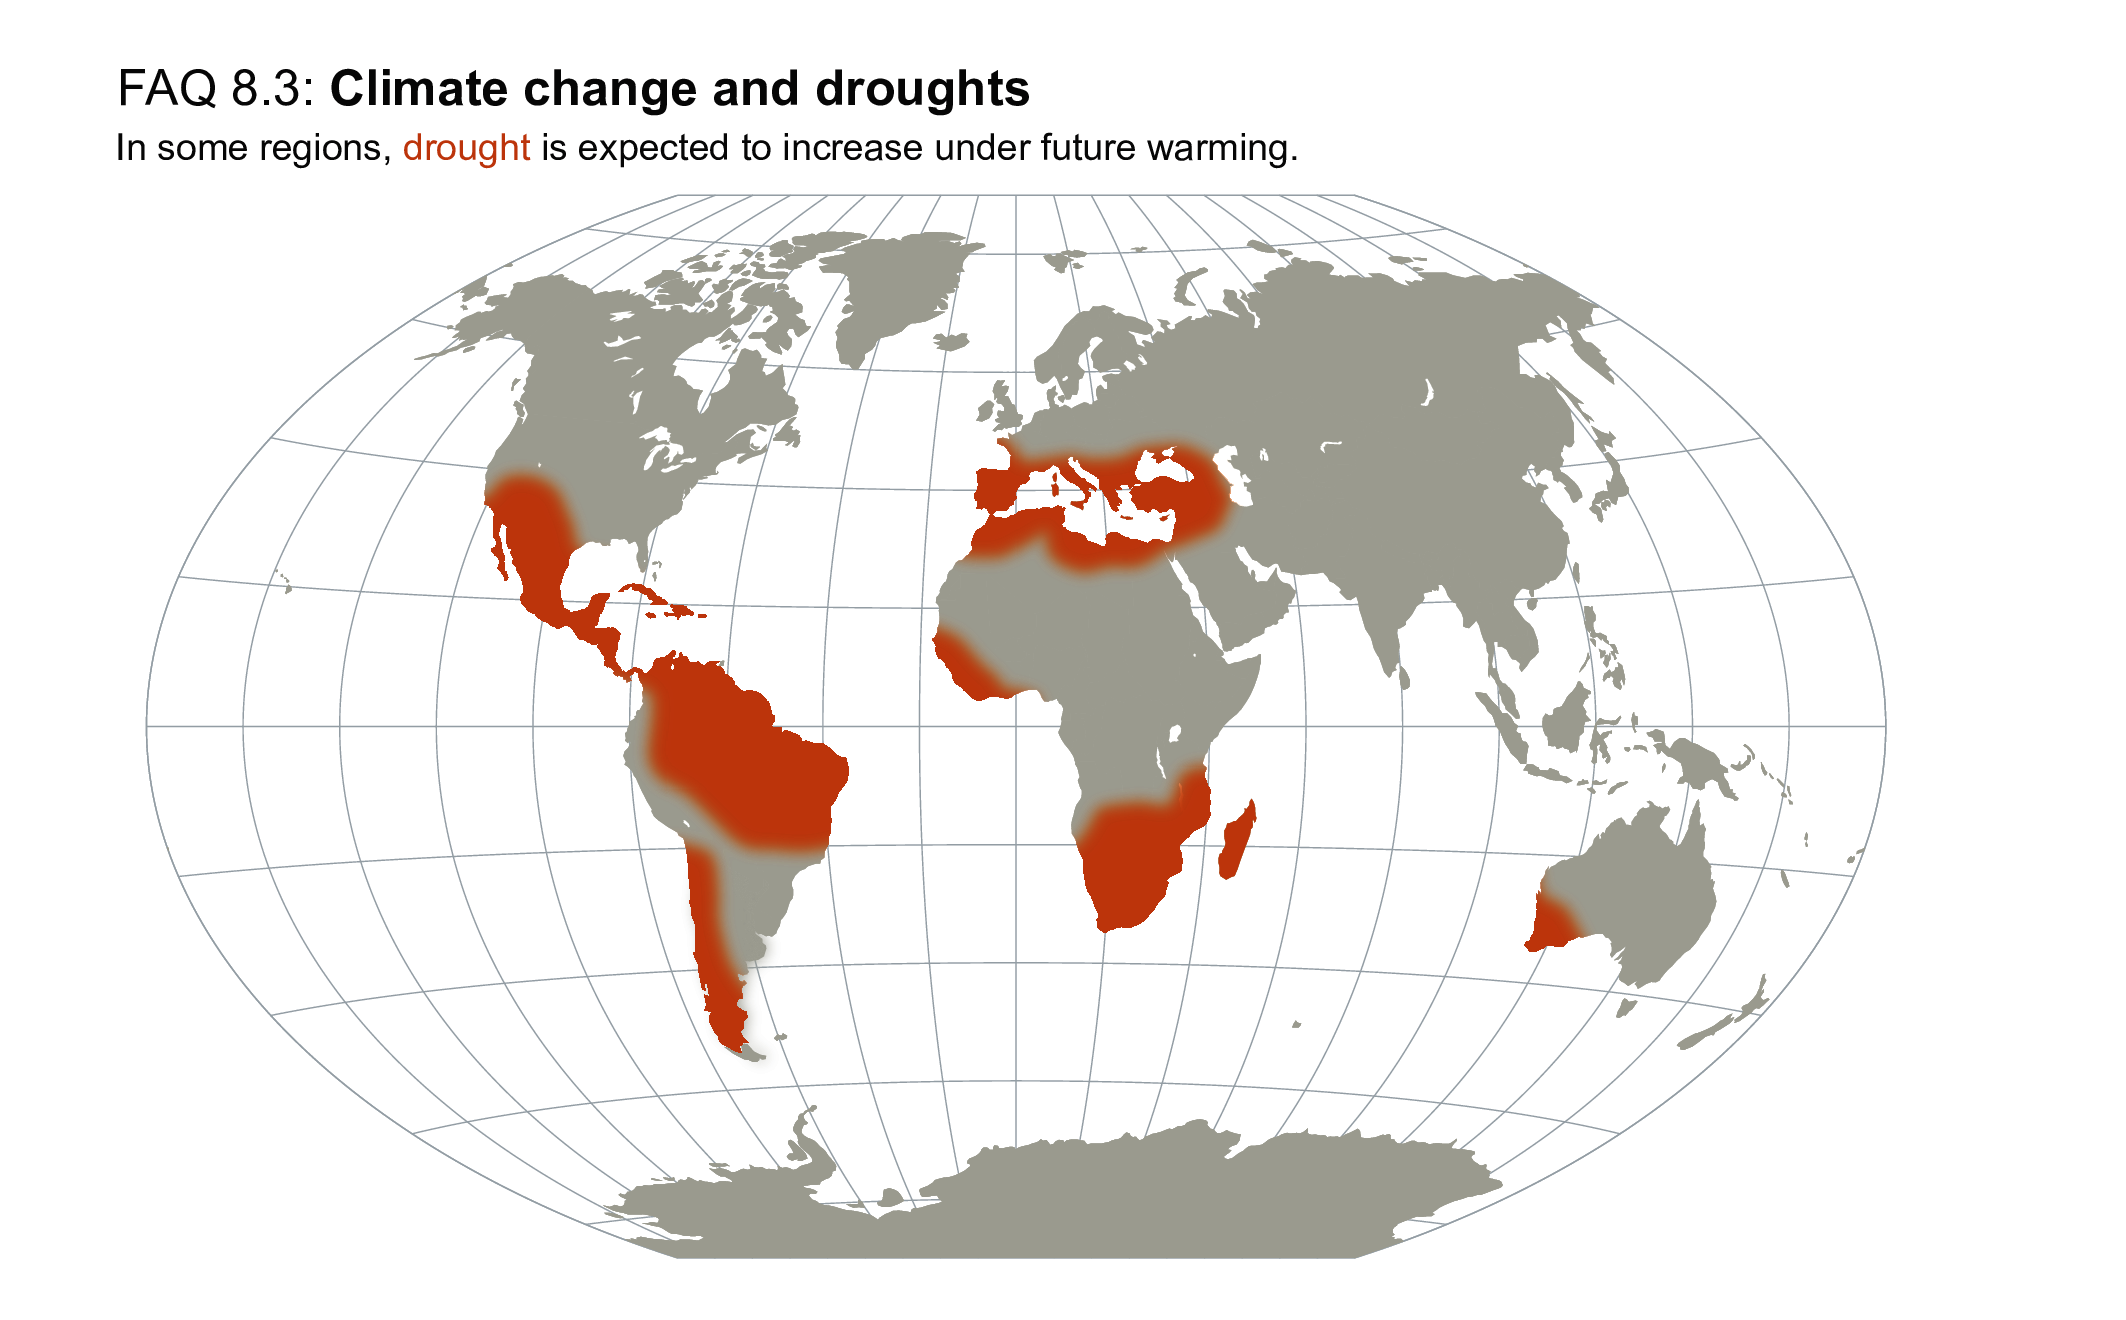
FAQ 8.3, Figure 1 | Schematic map highlighting in brown the regions where droughts are expected to become worse as a result of climate change. This pattern is similar regardless of the emissions scenario; however, the magnitude of change increases under higher emissions.