Back chapter figures
Figure 8.10
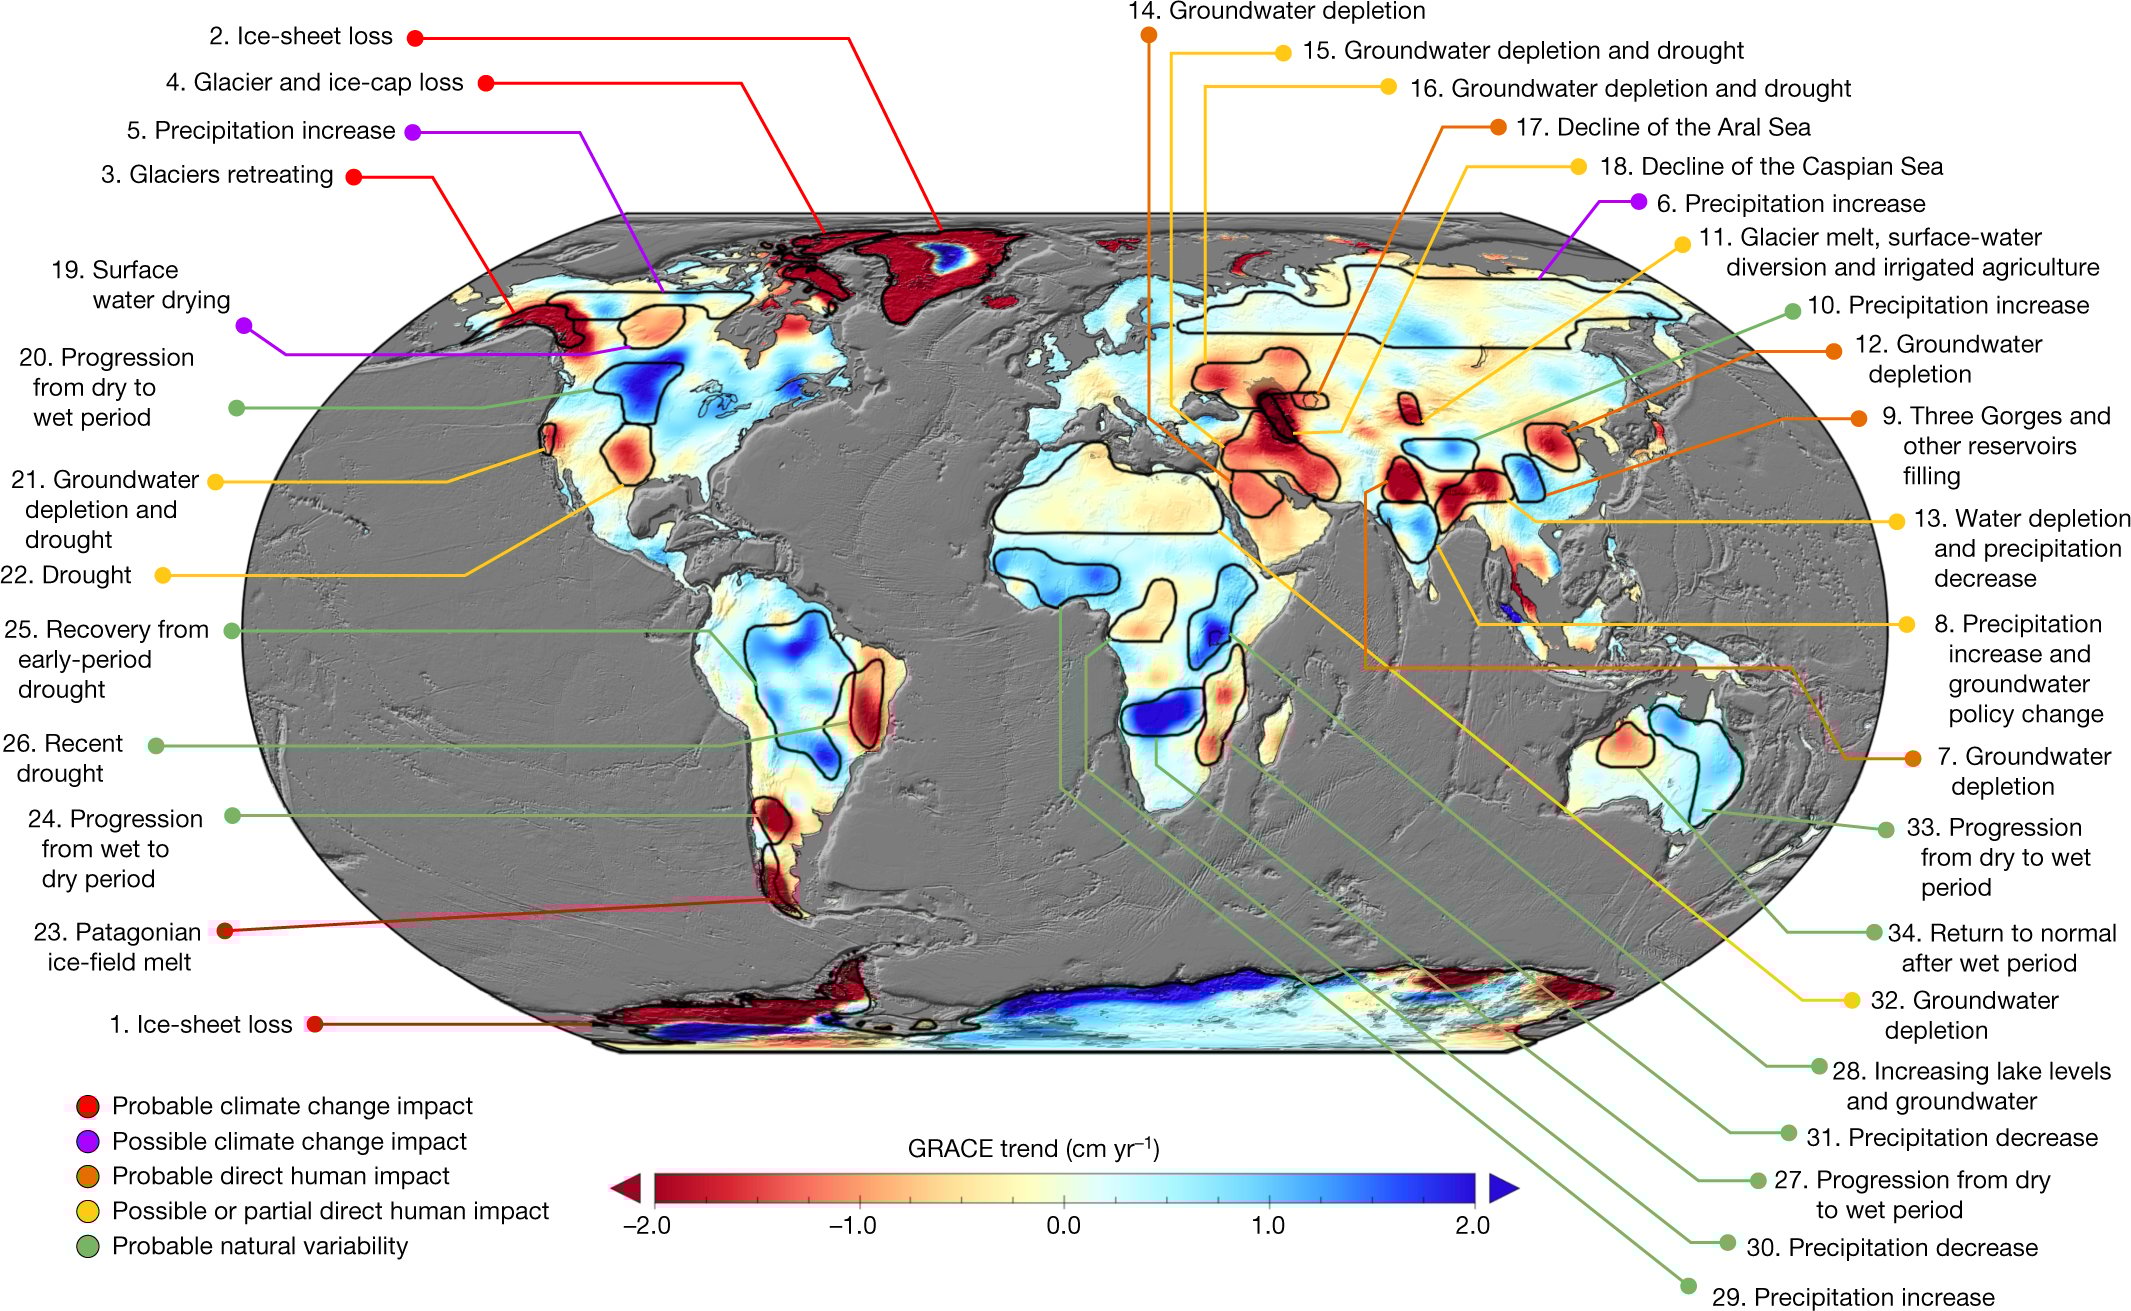
Figure caption
Figure 8.10 | Trends in Terrestrial Water Storage (TWS; in centimetres per year, cm yr–1) obtained on the basis of GRACE observations from April 2002 to March 2016. The cause of the trend in each outlined study region is briefly explained and colour-coded by category. The trend map was smoothed with a 150 km radius Gaussian filter for the purpose of visualization. However, all calculations were performed at the native 3° resolution of the data product. Figure from Rodell et al. (2018). Further details on data sources and processing are available in the chapter data table (Table 8.SM.1).