Back chapter figures
Figure 8.13
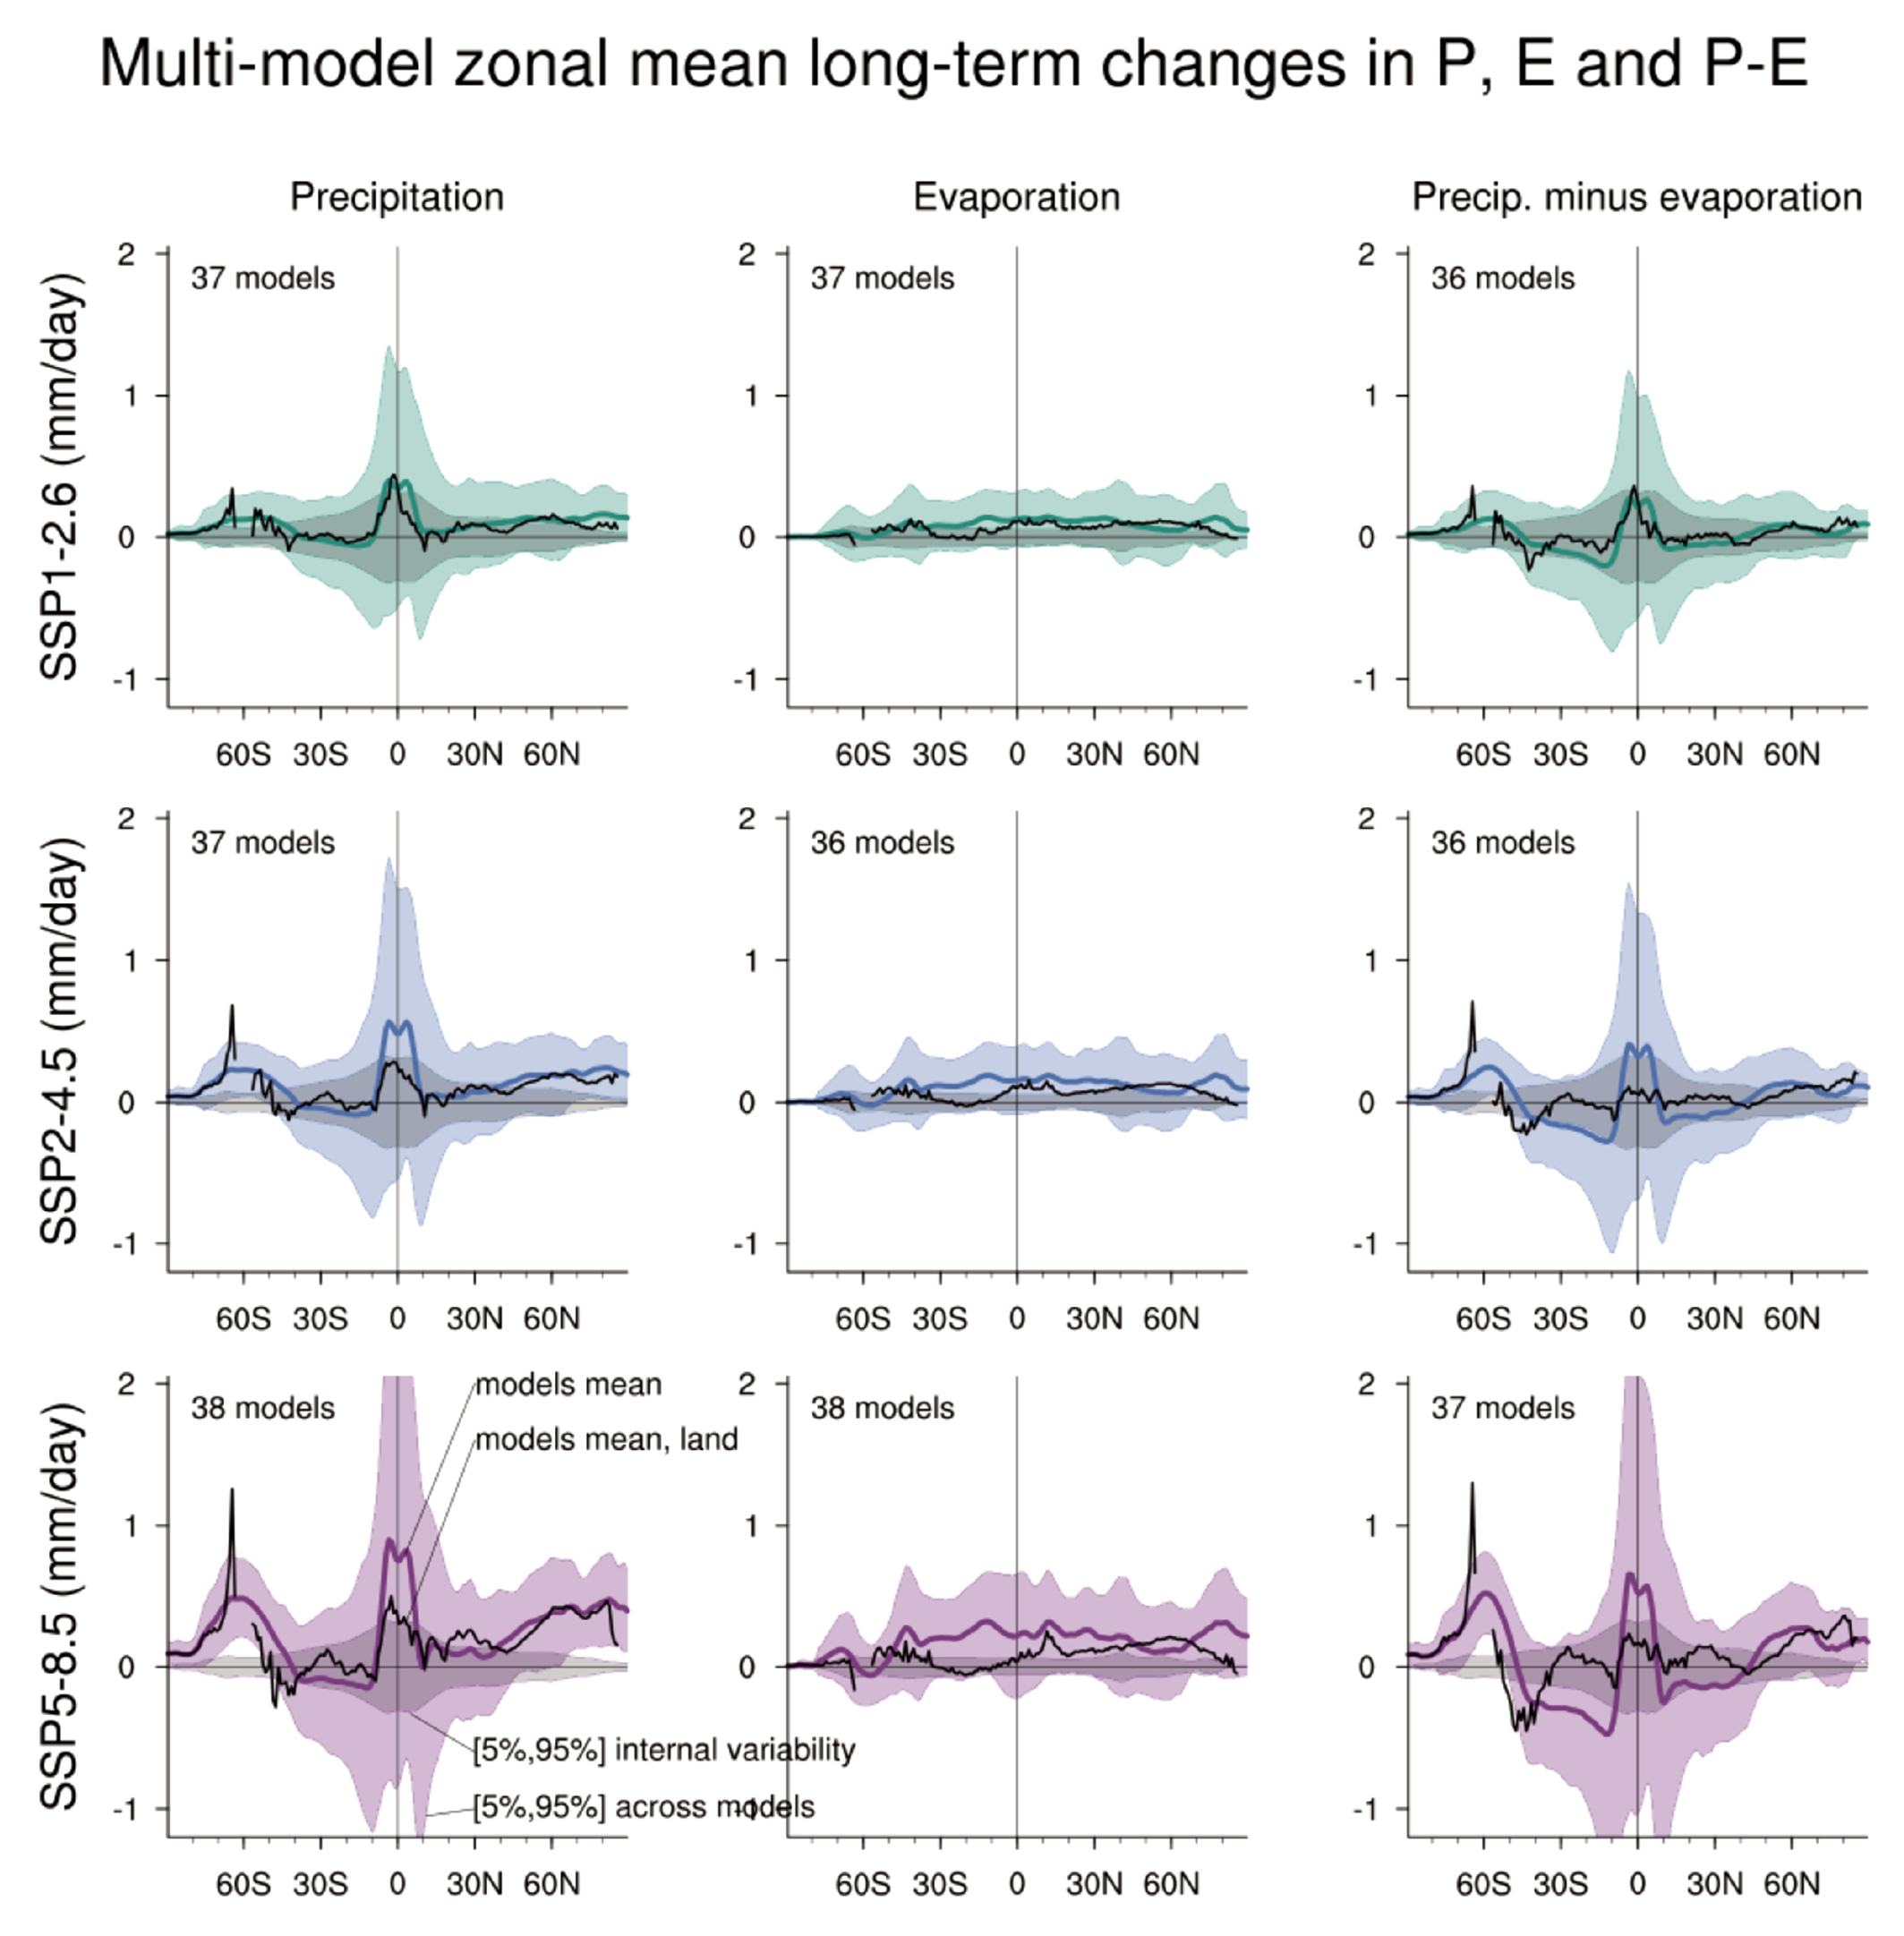
Figure caption
Figure 8.13 | Zonal and annual-mean projected long-term changes in the atmospheric water budget. Zonal and annual mean projected changes (mm day–1) in P (precipitation, left column), E (evaporation, middle column), and P–E (right column) over both land and ocean areas (coloured lines) and over land only (black lines) averaged across available CMIP6 models (number provided at the top left of each panel) in the SSP1-2.6 (top row), SSP2-4.5 (middle row) and SSP5-8.5 (bottom row) scenario, respectively. Shading denotes confidence intervals estimated from the CMIP6 ensemble under a normal distribution hypothesis. Colour shading denotes changes over both land and ocean. Grey shading represents internal variability derived from the pre-industrial control simulations. All changes are estimated for 2081–2100 relative to the 1995–2014 base period. Further details on data sources and processing are available in the chapter data table (Table 8.SM.1).