Back chapter figures
Figure 8.14
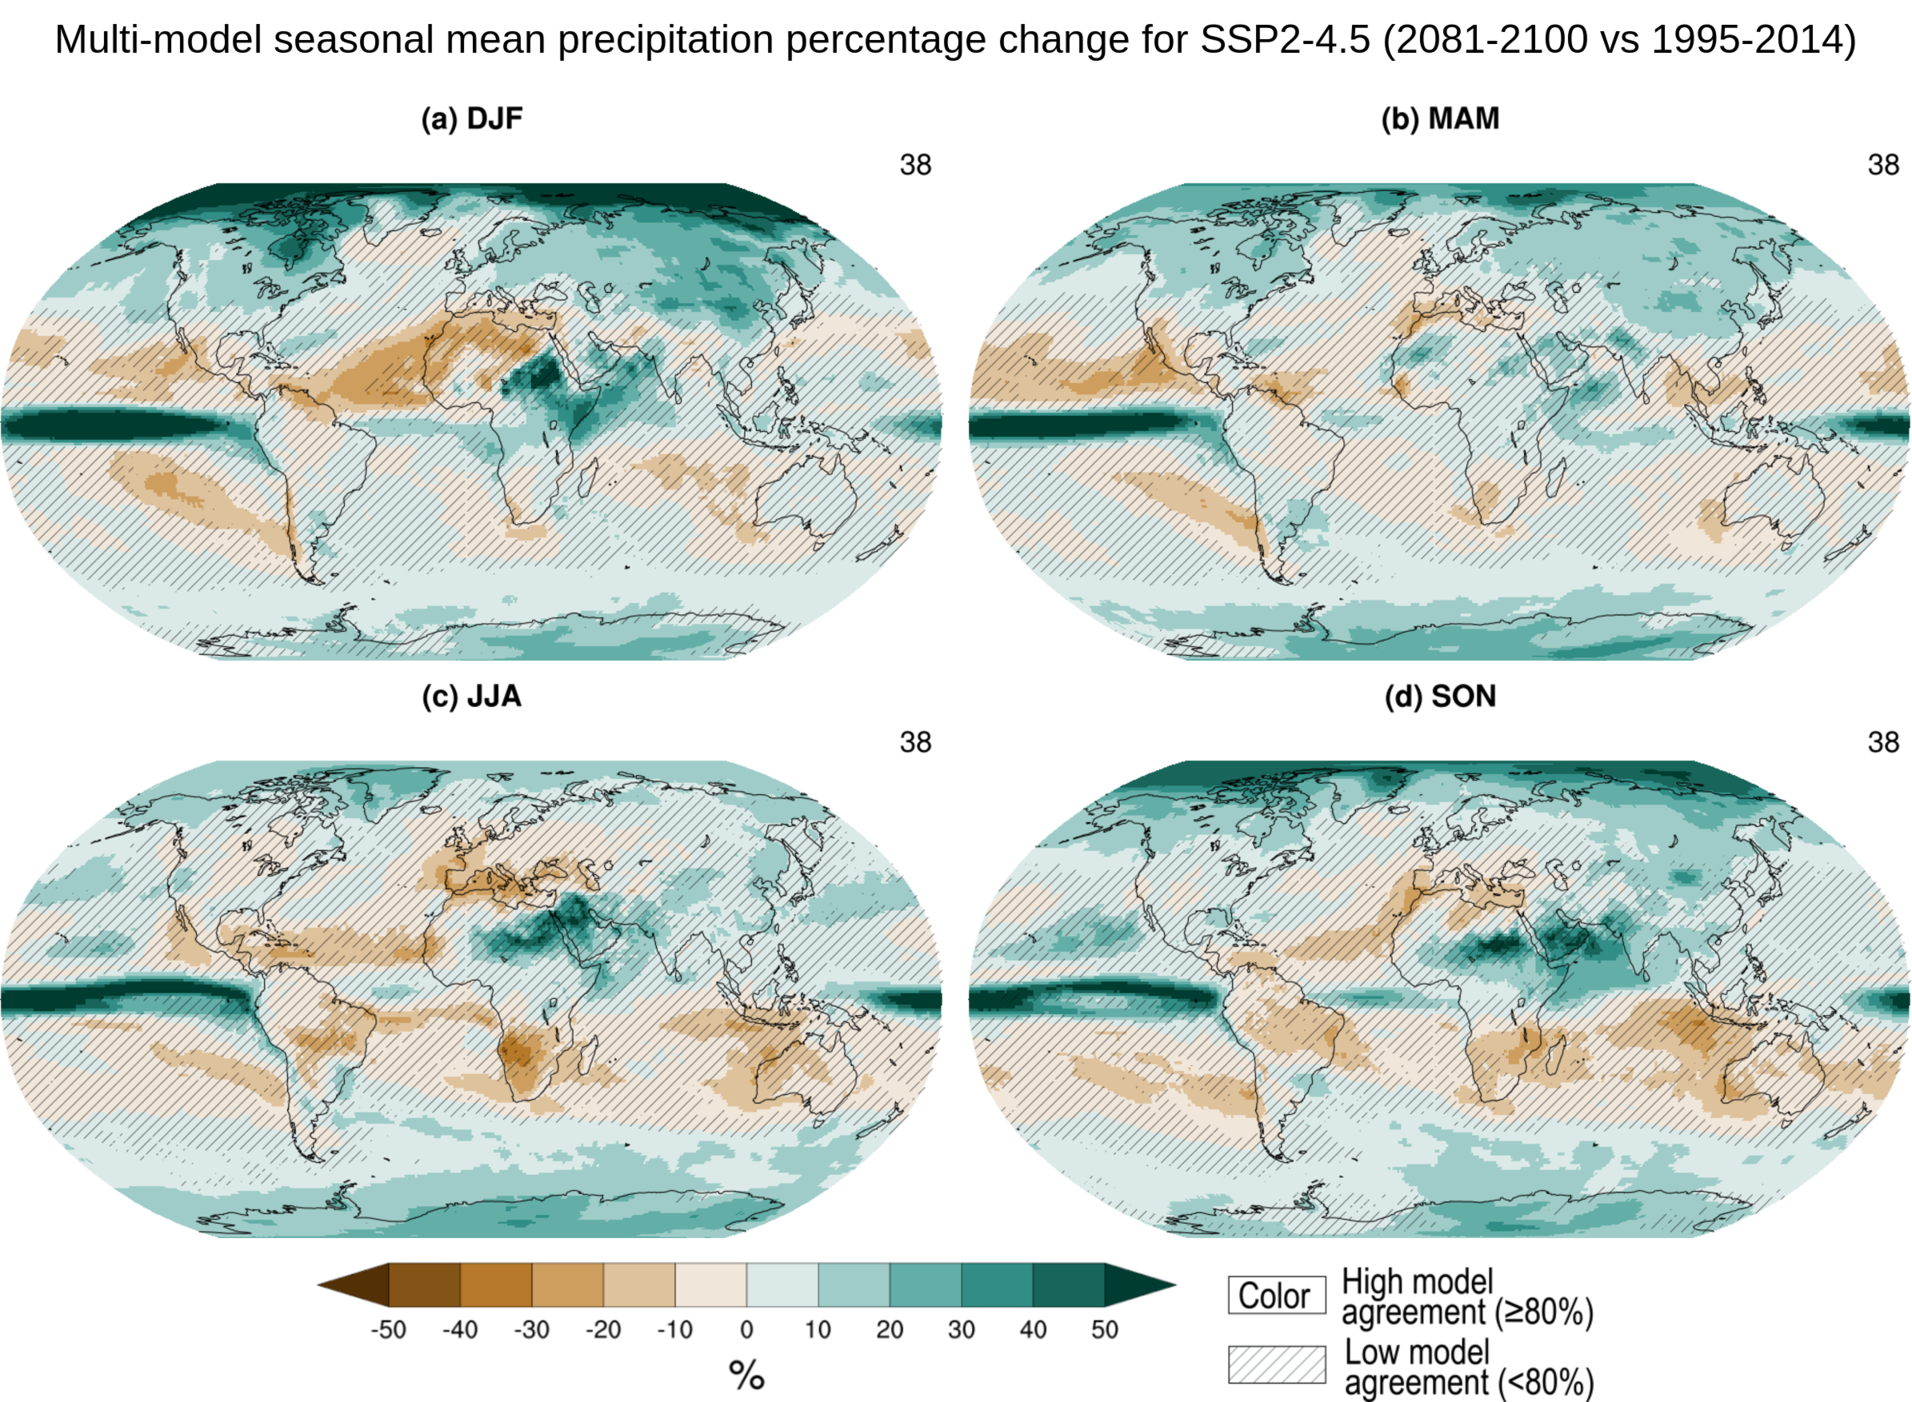
Figure caption
Figure 8.14 | Projected long-term relative changes in seasonal mean precipitation. Global maps of projected relative changes (%) in seasonal mean of precipitation averaged across available CMIP6 models (number provided at the top right of each panel) in the SSP2-4.5 scenario. All changes are estimated for 2081–2100 relative to the 1995–2014 base period. Uncertainty is represented using the simple approach. No overlay indicates regions with high model agreement, where ≥80% of models agree on sign of change; diagonal lines indicate regions with low model agreement, where <80% of models agree on sign of change. For more information on the simple approach, please refer to the Cross-Chapter Box Atlas.1. Further details on data sources and processing are available in the chapter data table (Table 8.SM.1).