Back chapter figures
Figure 8.19
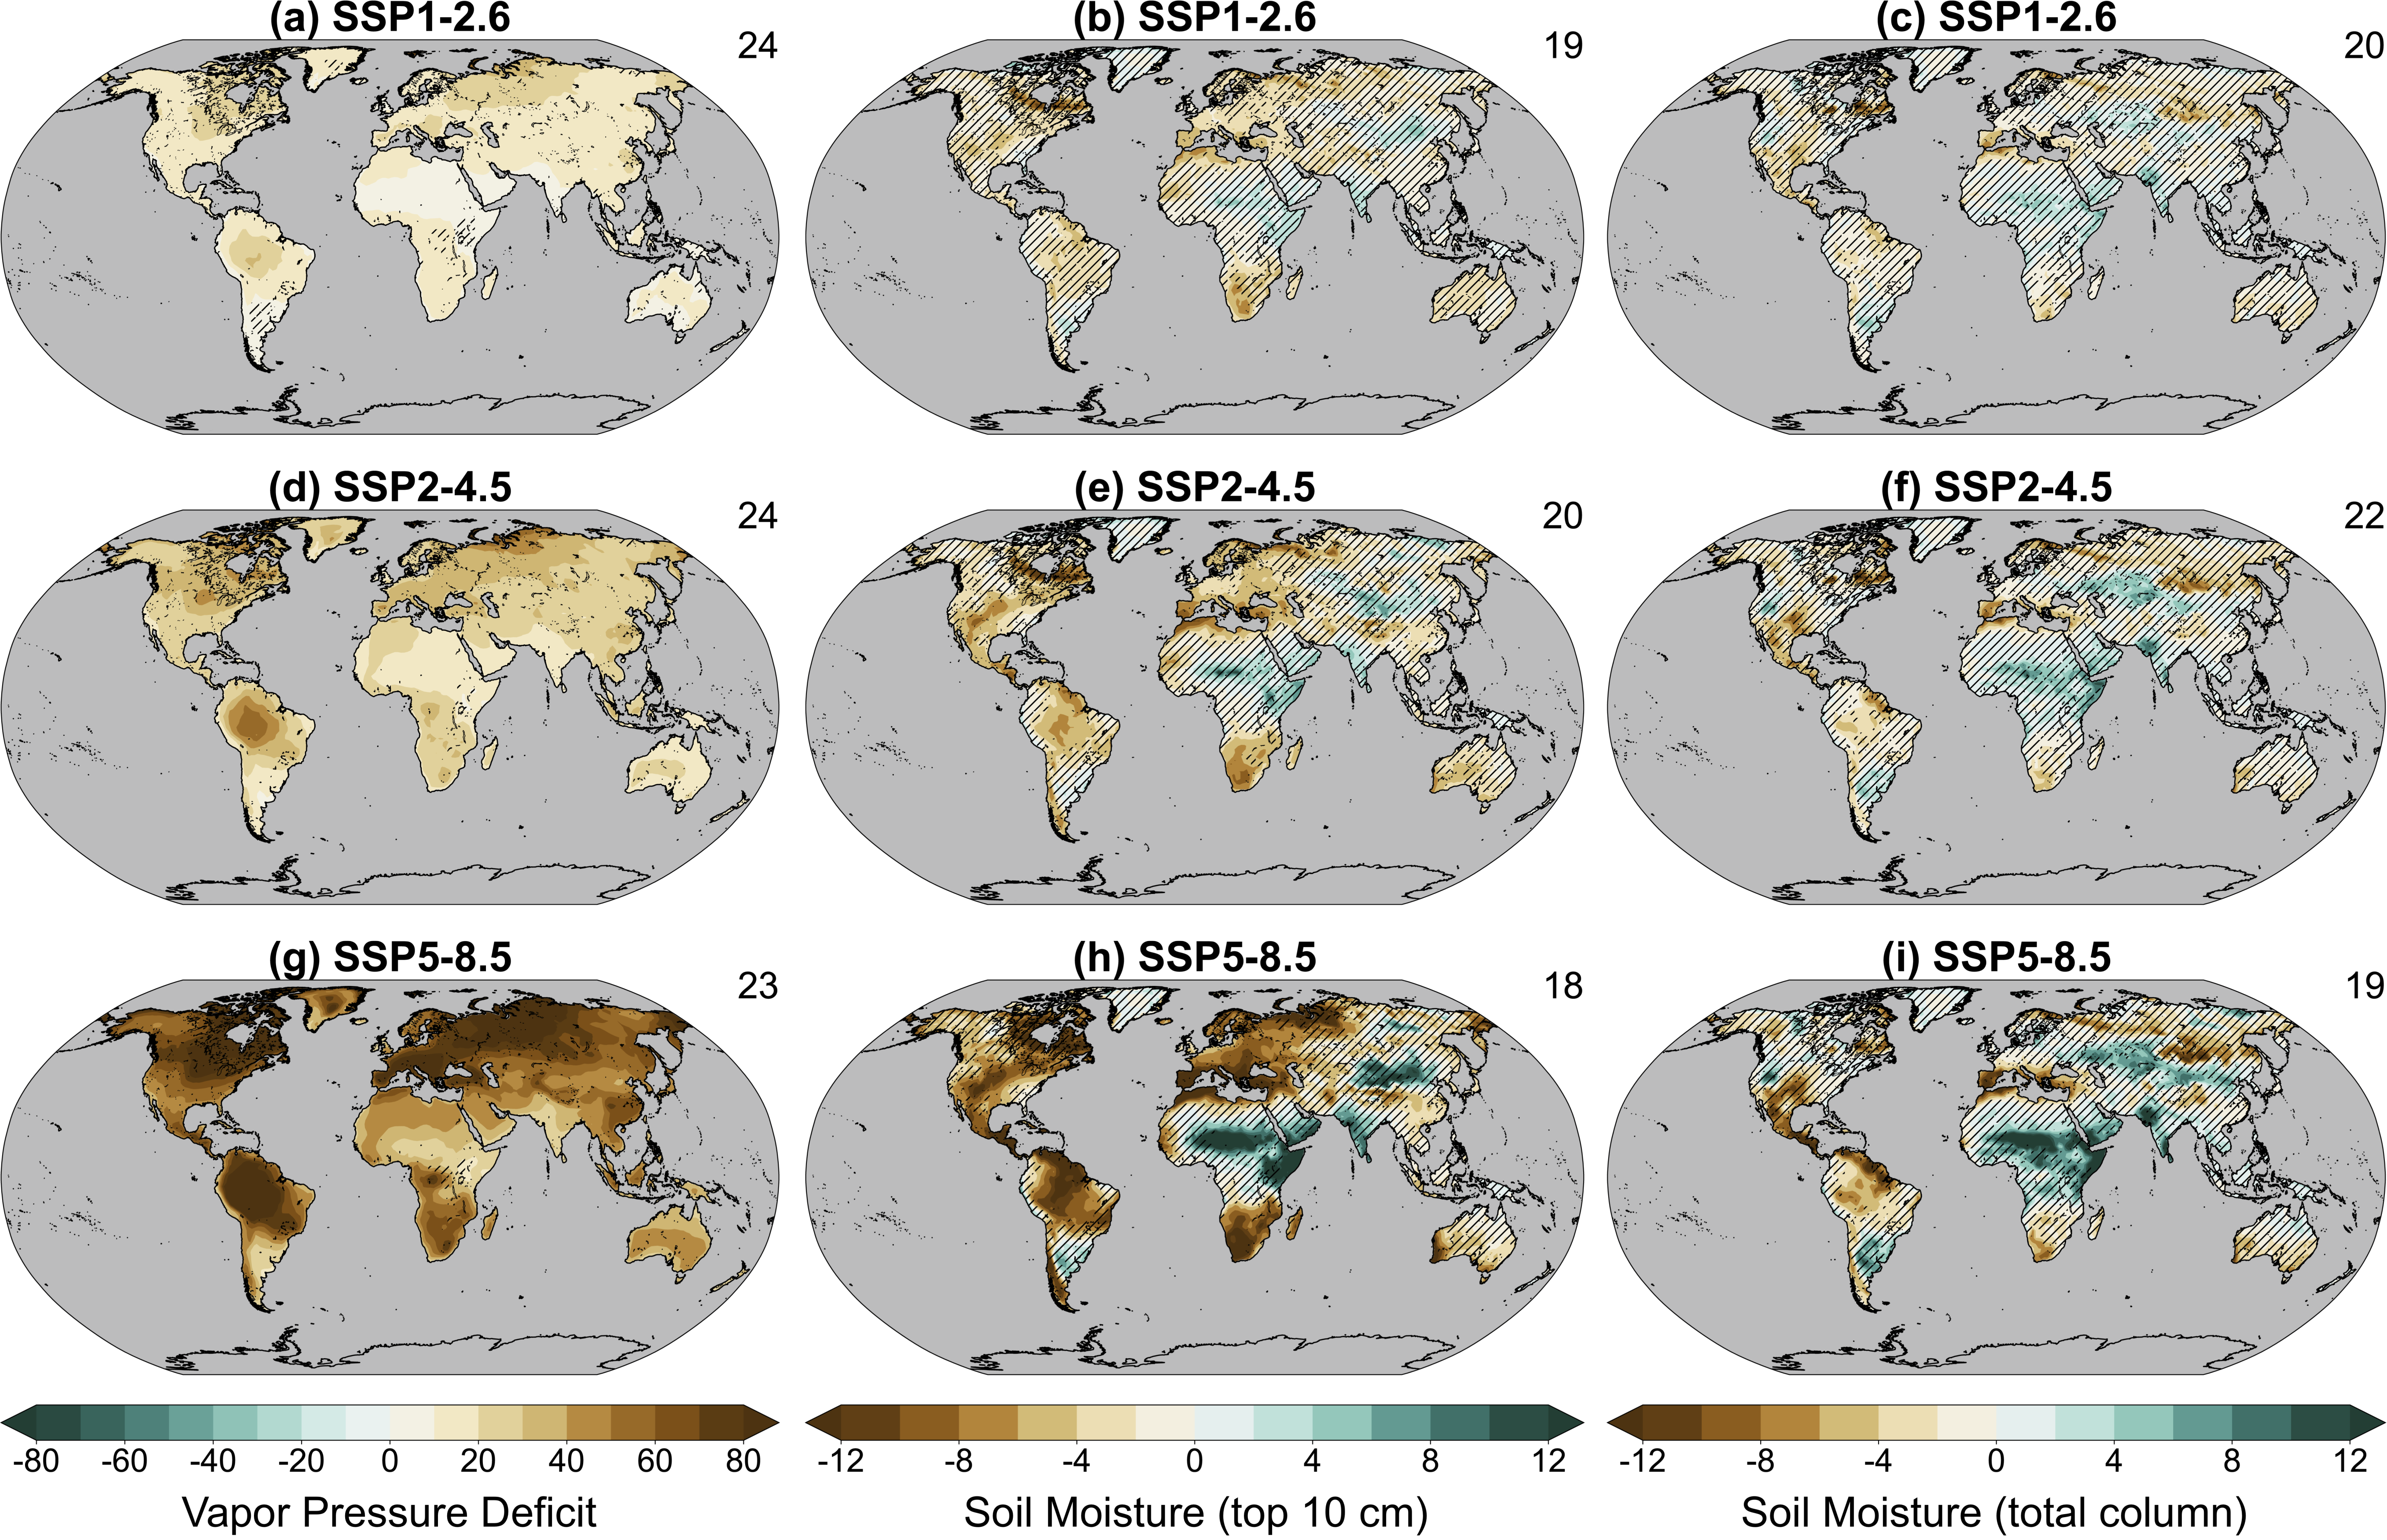
Figure caption
Figure 8.19 | Projected long-term relative changes in annual mean soil moisture and vapour pressure deficit. Global maps of projected relative changes (%) in annual mean vapor pressure deficit (left), surface soil moisture (top 10cm, middle) and total column soil moisture (right) from available CMIP6 models (number provided at the top right of each panel) for the SSP1.2-6 (a, b, c), SSP2-4.5 (d, e, f) and SSP5-8.5 (g, h, i) scenarios respectively. All changes are estimated for 2081–2100 relative to a 1995–2014 base period. Uncertainty is represented using the simple approach. No overlay indicates regions with high model agreement (‘Robust change’), where ≥80% of models agree on sign of change, diagonal lines indicate regions with low model agreement, where <80% of models agree on sign of change. For more information on the simple approach, please refer to the Cross-Chapter Box Atlas.1. Further details on data sources and processing are available in the chapter data table (Table 8.SM.1).