Back chapter figures
Figure 8.20
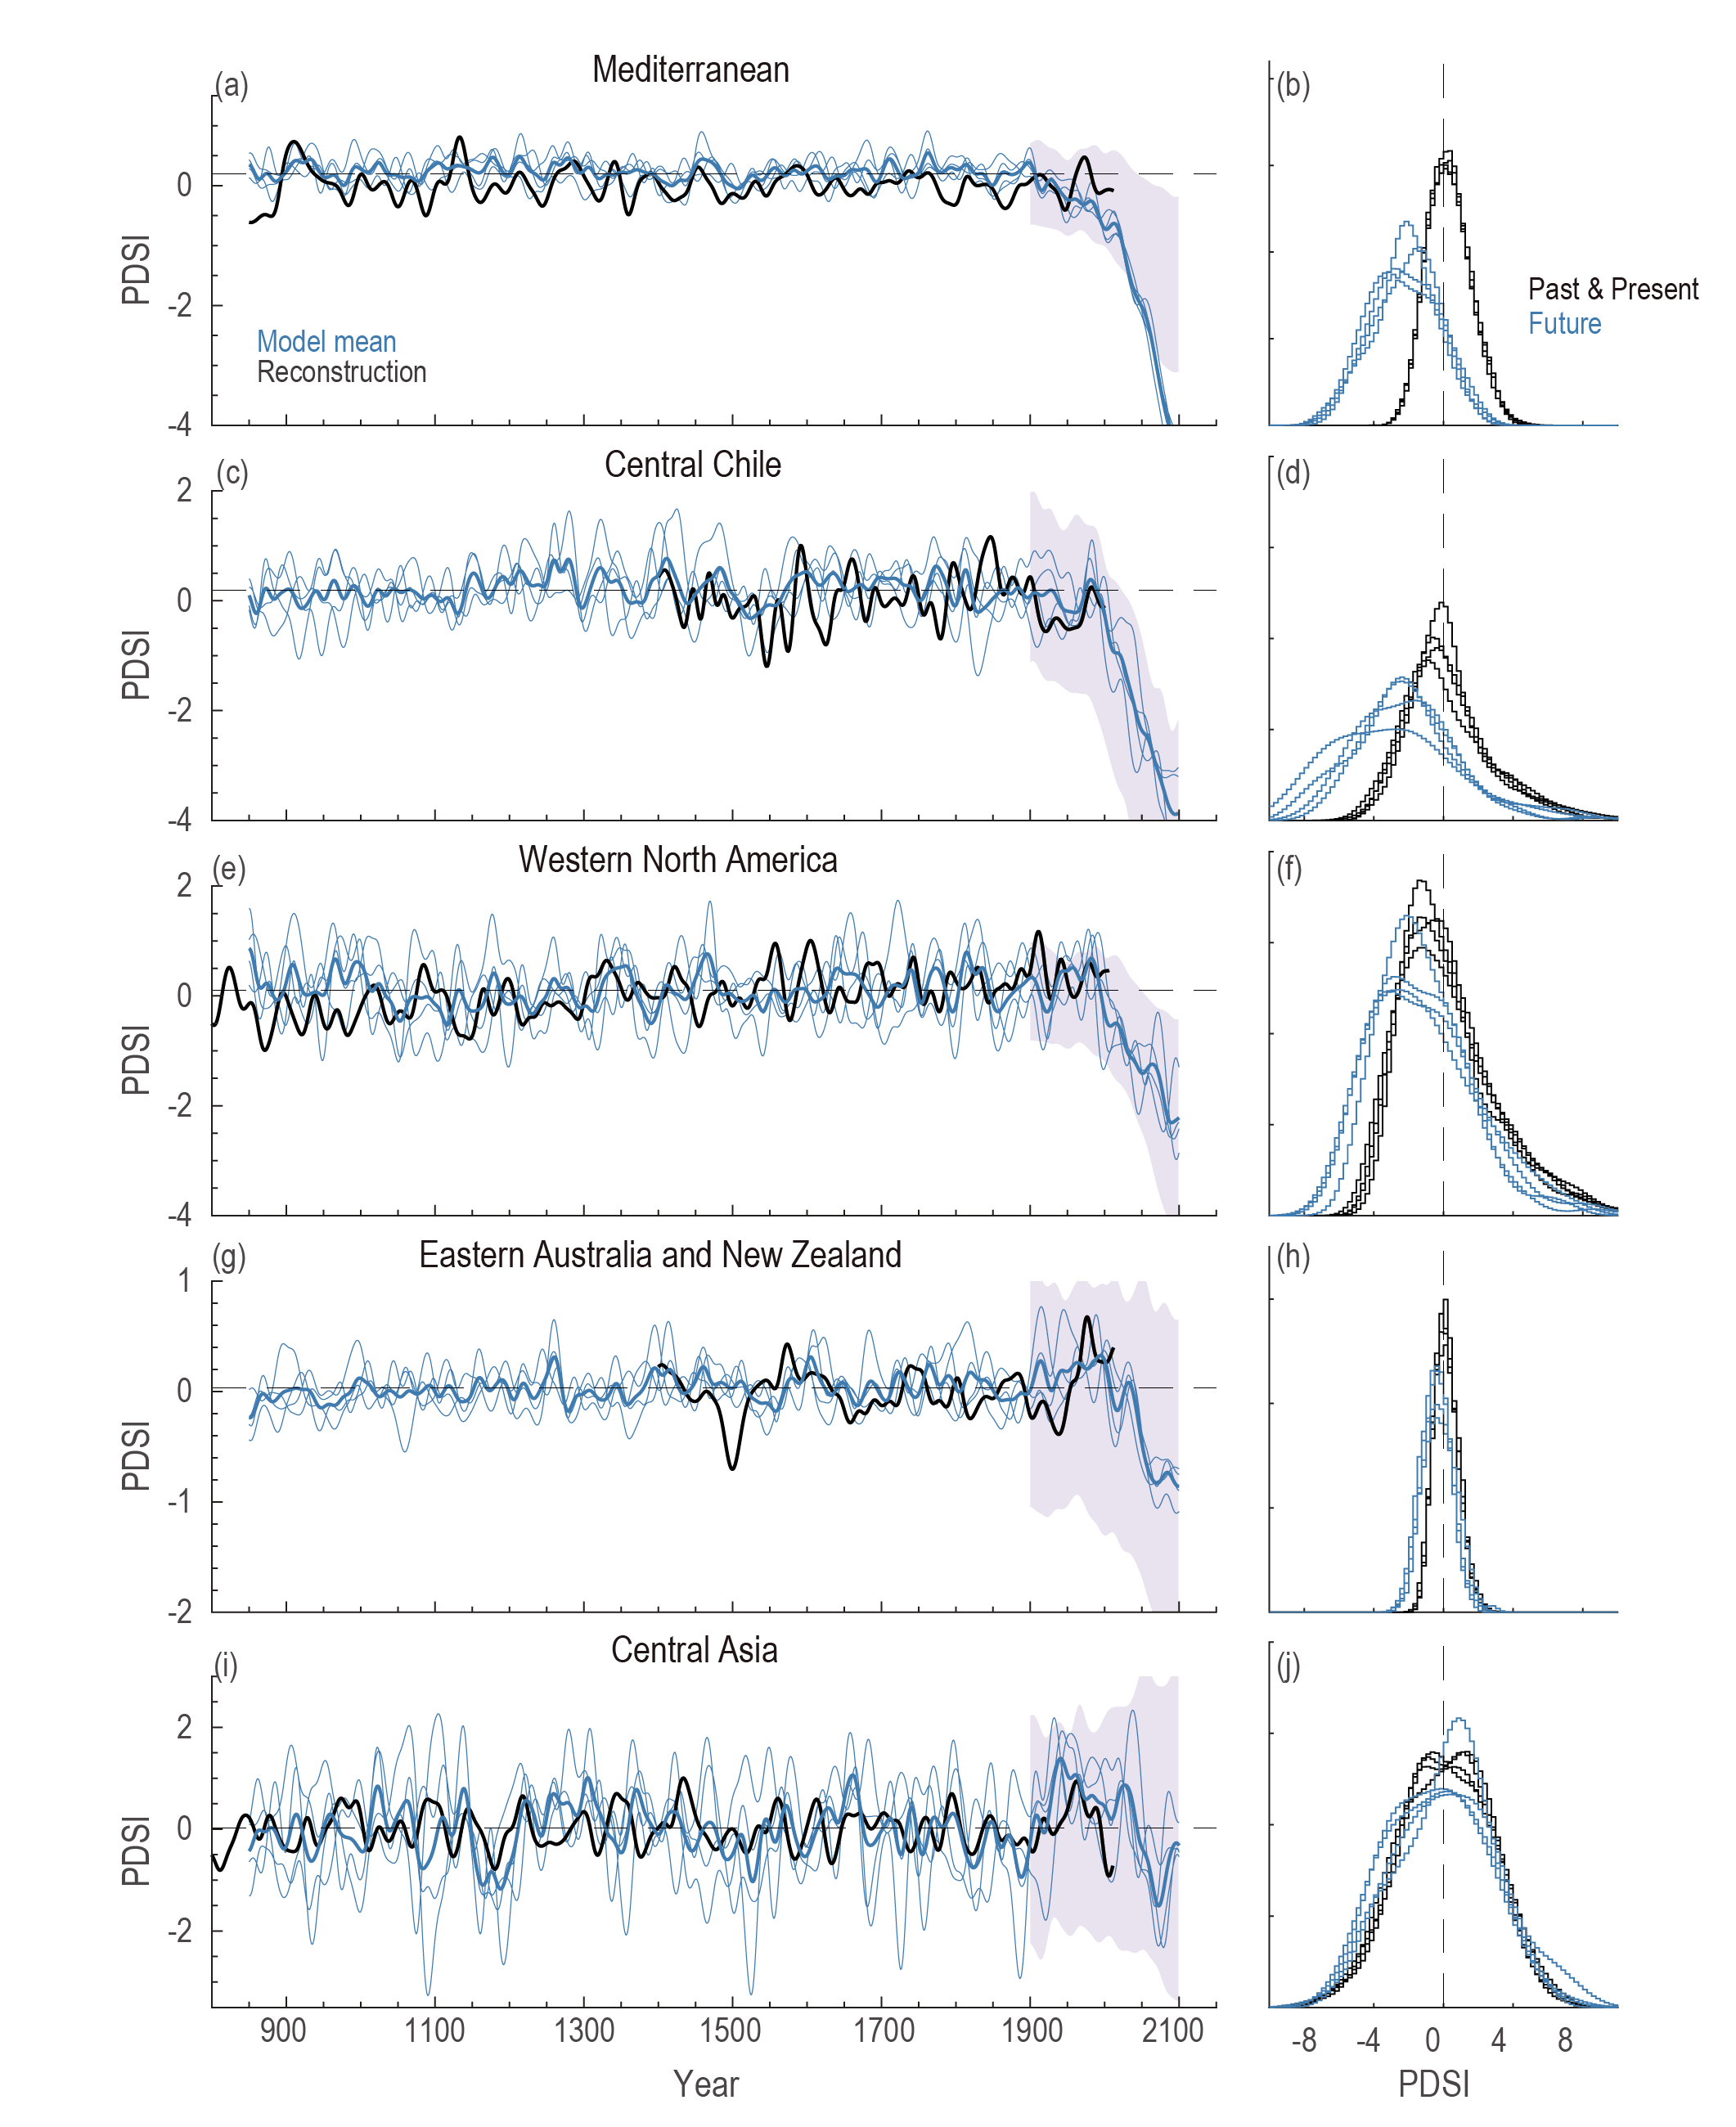
Figure caption
Figure 8.20 | Past-to-future drought variability in paleoclimate reconstructions and models for select regions. On the left (a, c, e, g, i), tree-ring reconstructed Palmer Drought Severity Index (PDSI) series (black line) for the Mediterranean (10°W–45°E, 30°–47°N; E.R. Cook et al., 2015; Cook et al., 2016a), central Chile (70°W–74°W, 32°S–37°S; Morales et al., 2020), western North America (117°W–124°W, 32°N–38°N; Cook et al., 2010; Griffin and Anchukaitis, 2014), Eastern Australia and New Zealand (136°E–178°E, 46°S–11°S; Palmer et al., 2015), and Central Asia (99°E–107°E, 47°N–49°N; Pederson et al., 2014; Hessl et al., 2018) plotted in comparison to the past-to-future, fully-forced simulations from four ensemble members (thin blue lines) from the NCAR CESM Last Millennium Ensemble (thick blue line = ensemble mean) (Otto-Bliesner et al., 2016) for the same regions. The shaded area represents the range (10th to 90th percentile) of historical and future (RCP8.5) PDSI (Penman–Monteith) simulations from 15 CMIP5 models and 34 ensemble members for the same regions (1900–2100; Cook et al., 2014). On the right (b, d, f, h, j), the distribution of annual PDSI values from the past and present (850 to 2005 CE) (black) is compared to the future distribution (2006 to 2100 CE) (blue). The distributions show each of the four ensemble members from the CESM LME simulations. The future component of the CESM LME follows the RCP8.5 scenario. Further details on data sources and processing are available in the chapter data table (Table 8.SM.1).