Back chapter figures
Figure 8.21
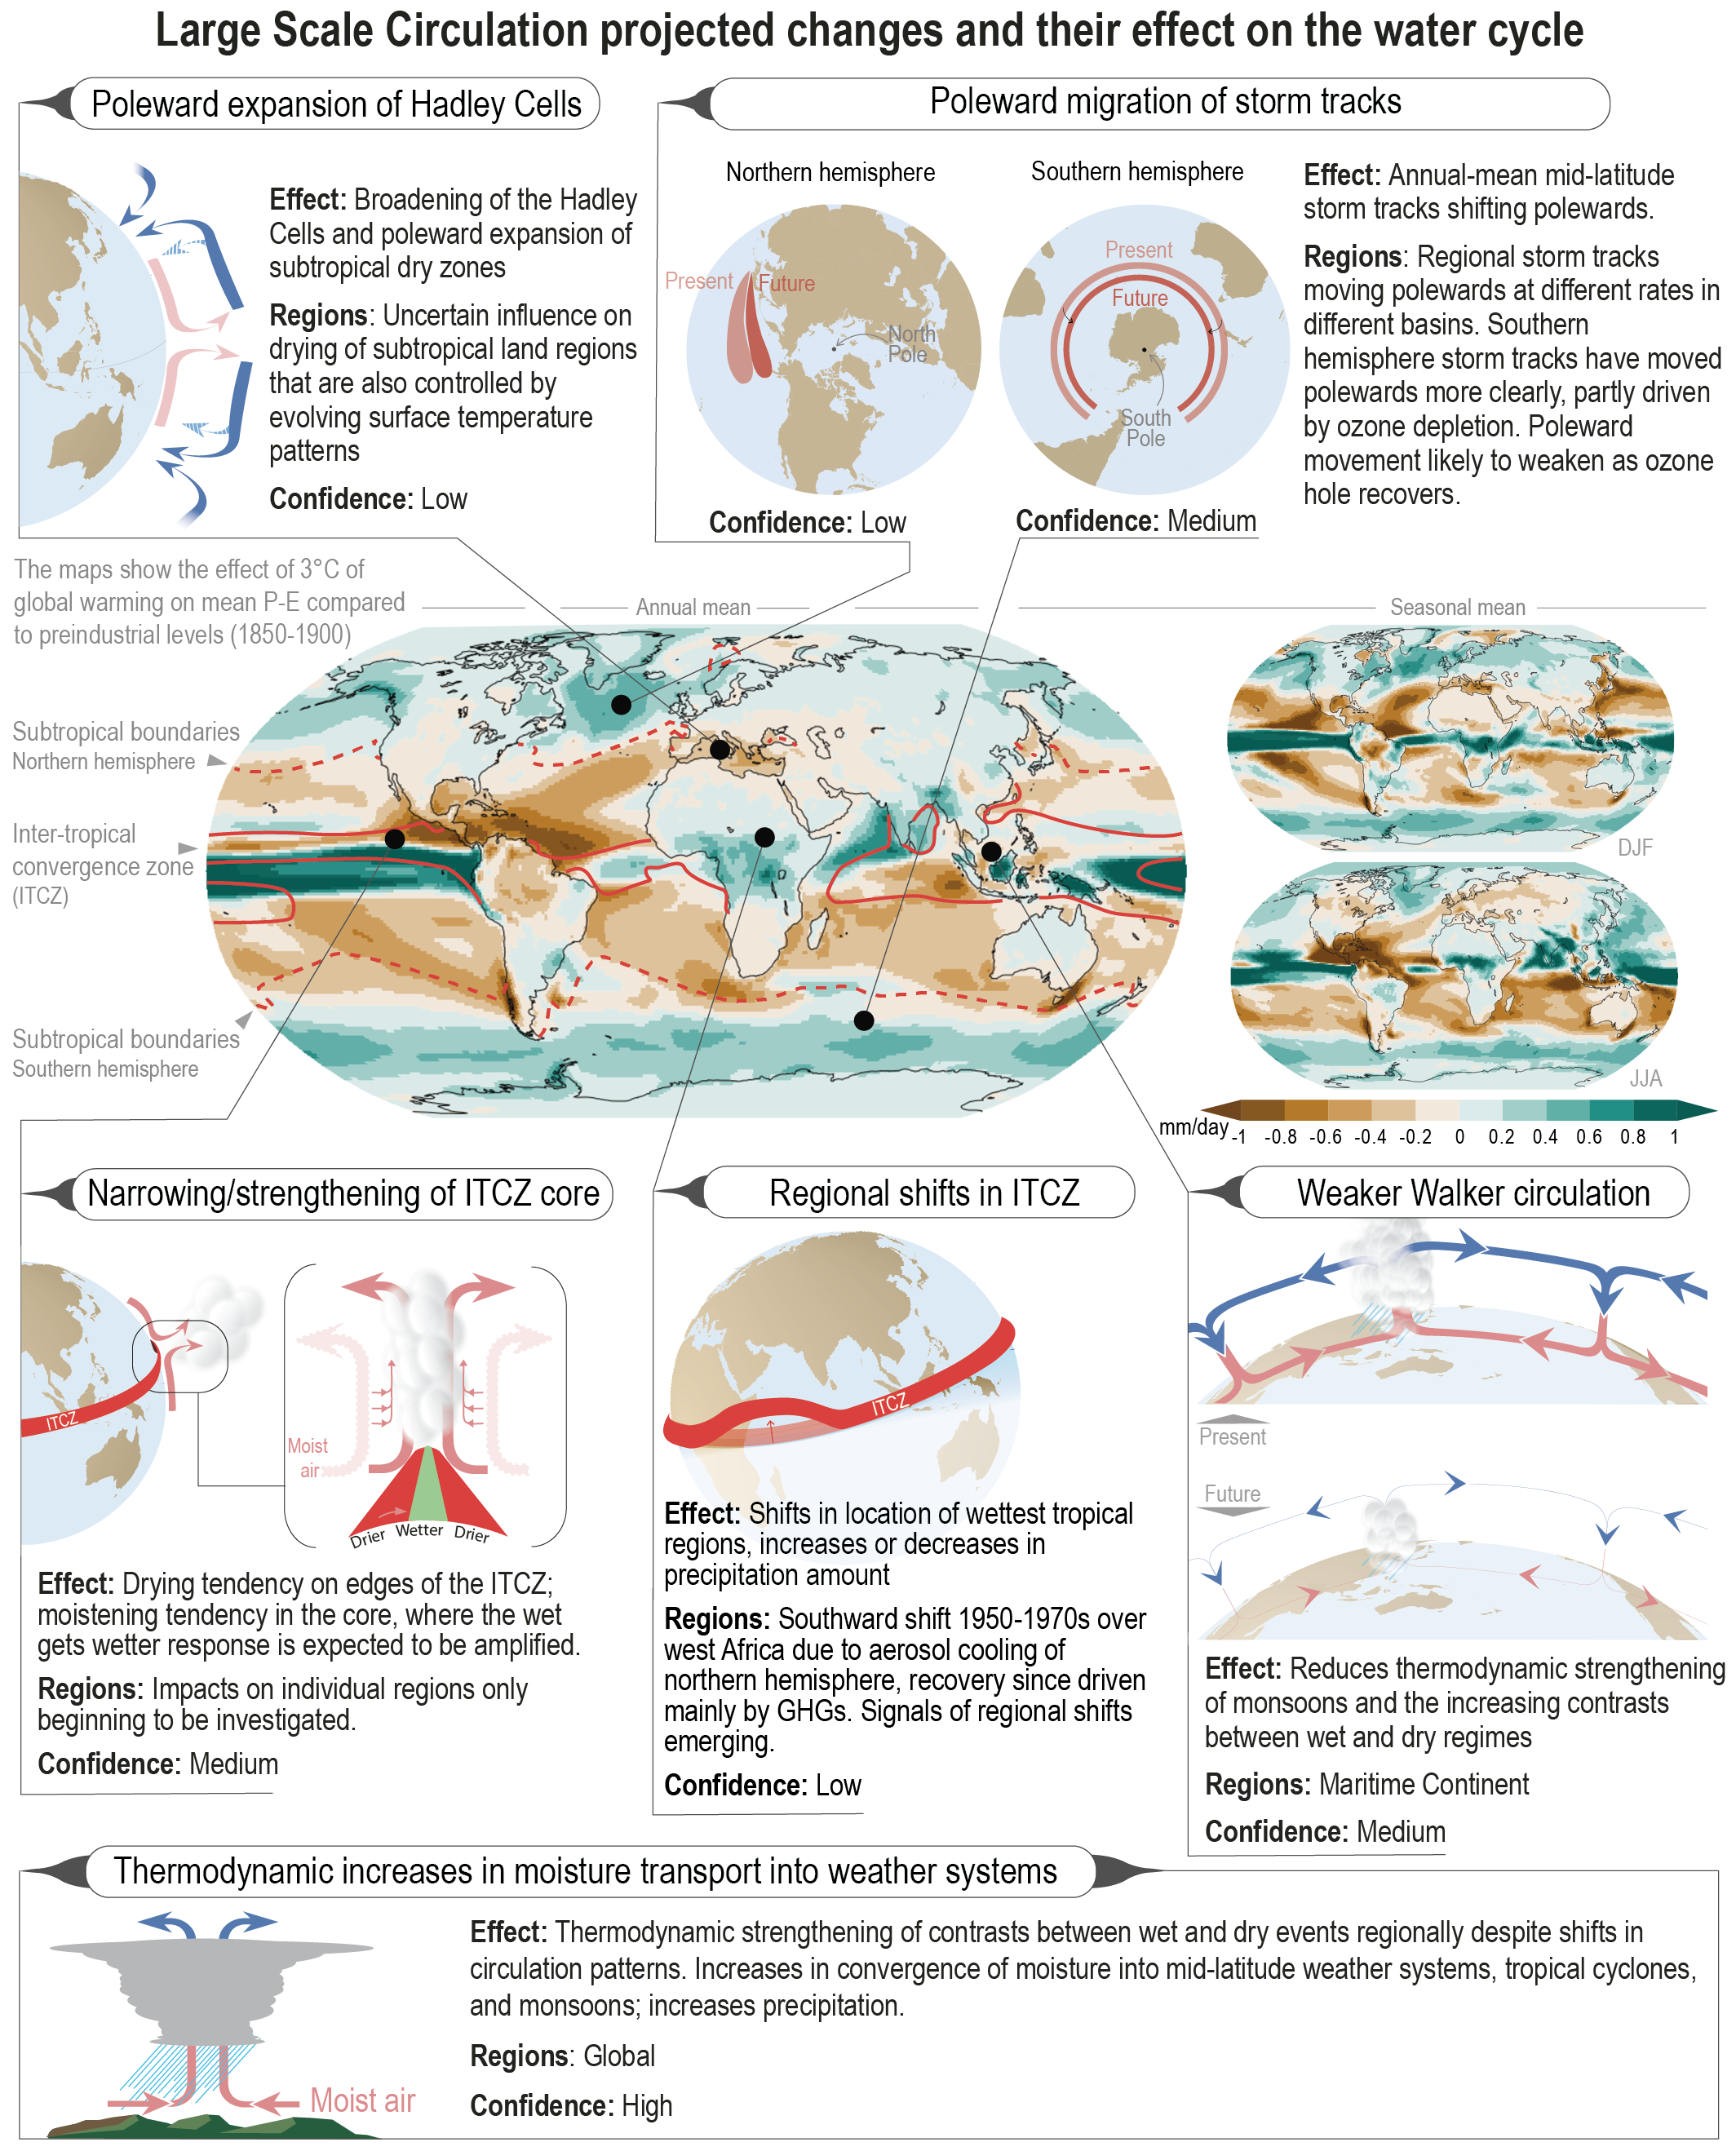
Figure caption
Figure 8.21 | Schematic depicting large-scale circulation changes and impacts on the regional water cycle. The central figures show precipitation minus evaporation (P–E) changes at 3°C or global warming relative to an 1850–1900 base period (mean of 23 CMIP6 SSP5-8.5 simulations). Annual mean changes (large map) include contours (ocean only) depicting control climate P–E = 0 mm day–1lines with the solid contour enclosing the tropical rain belt region and dashed lines representing the edges of subtropical regions. Confidence levels assess understanding of how large-scale circulation change affect the regional water.