Back chapter figures
Figure 8.23
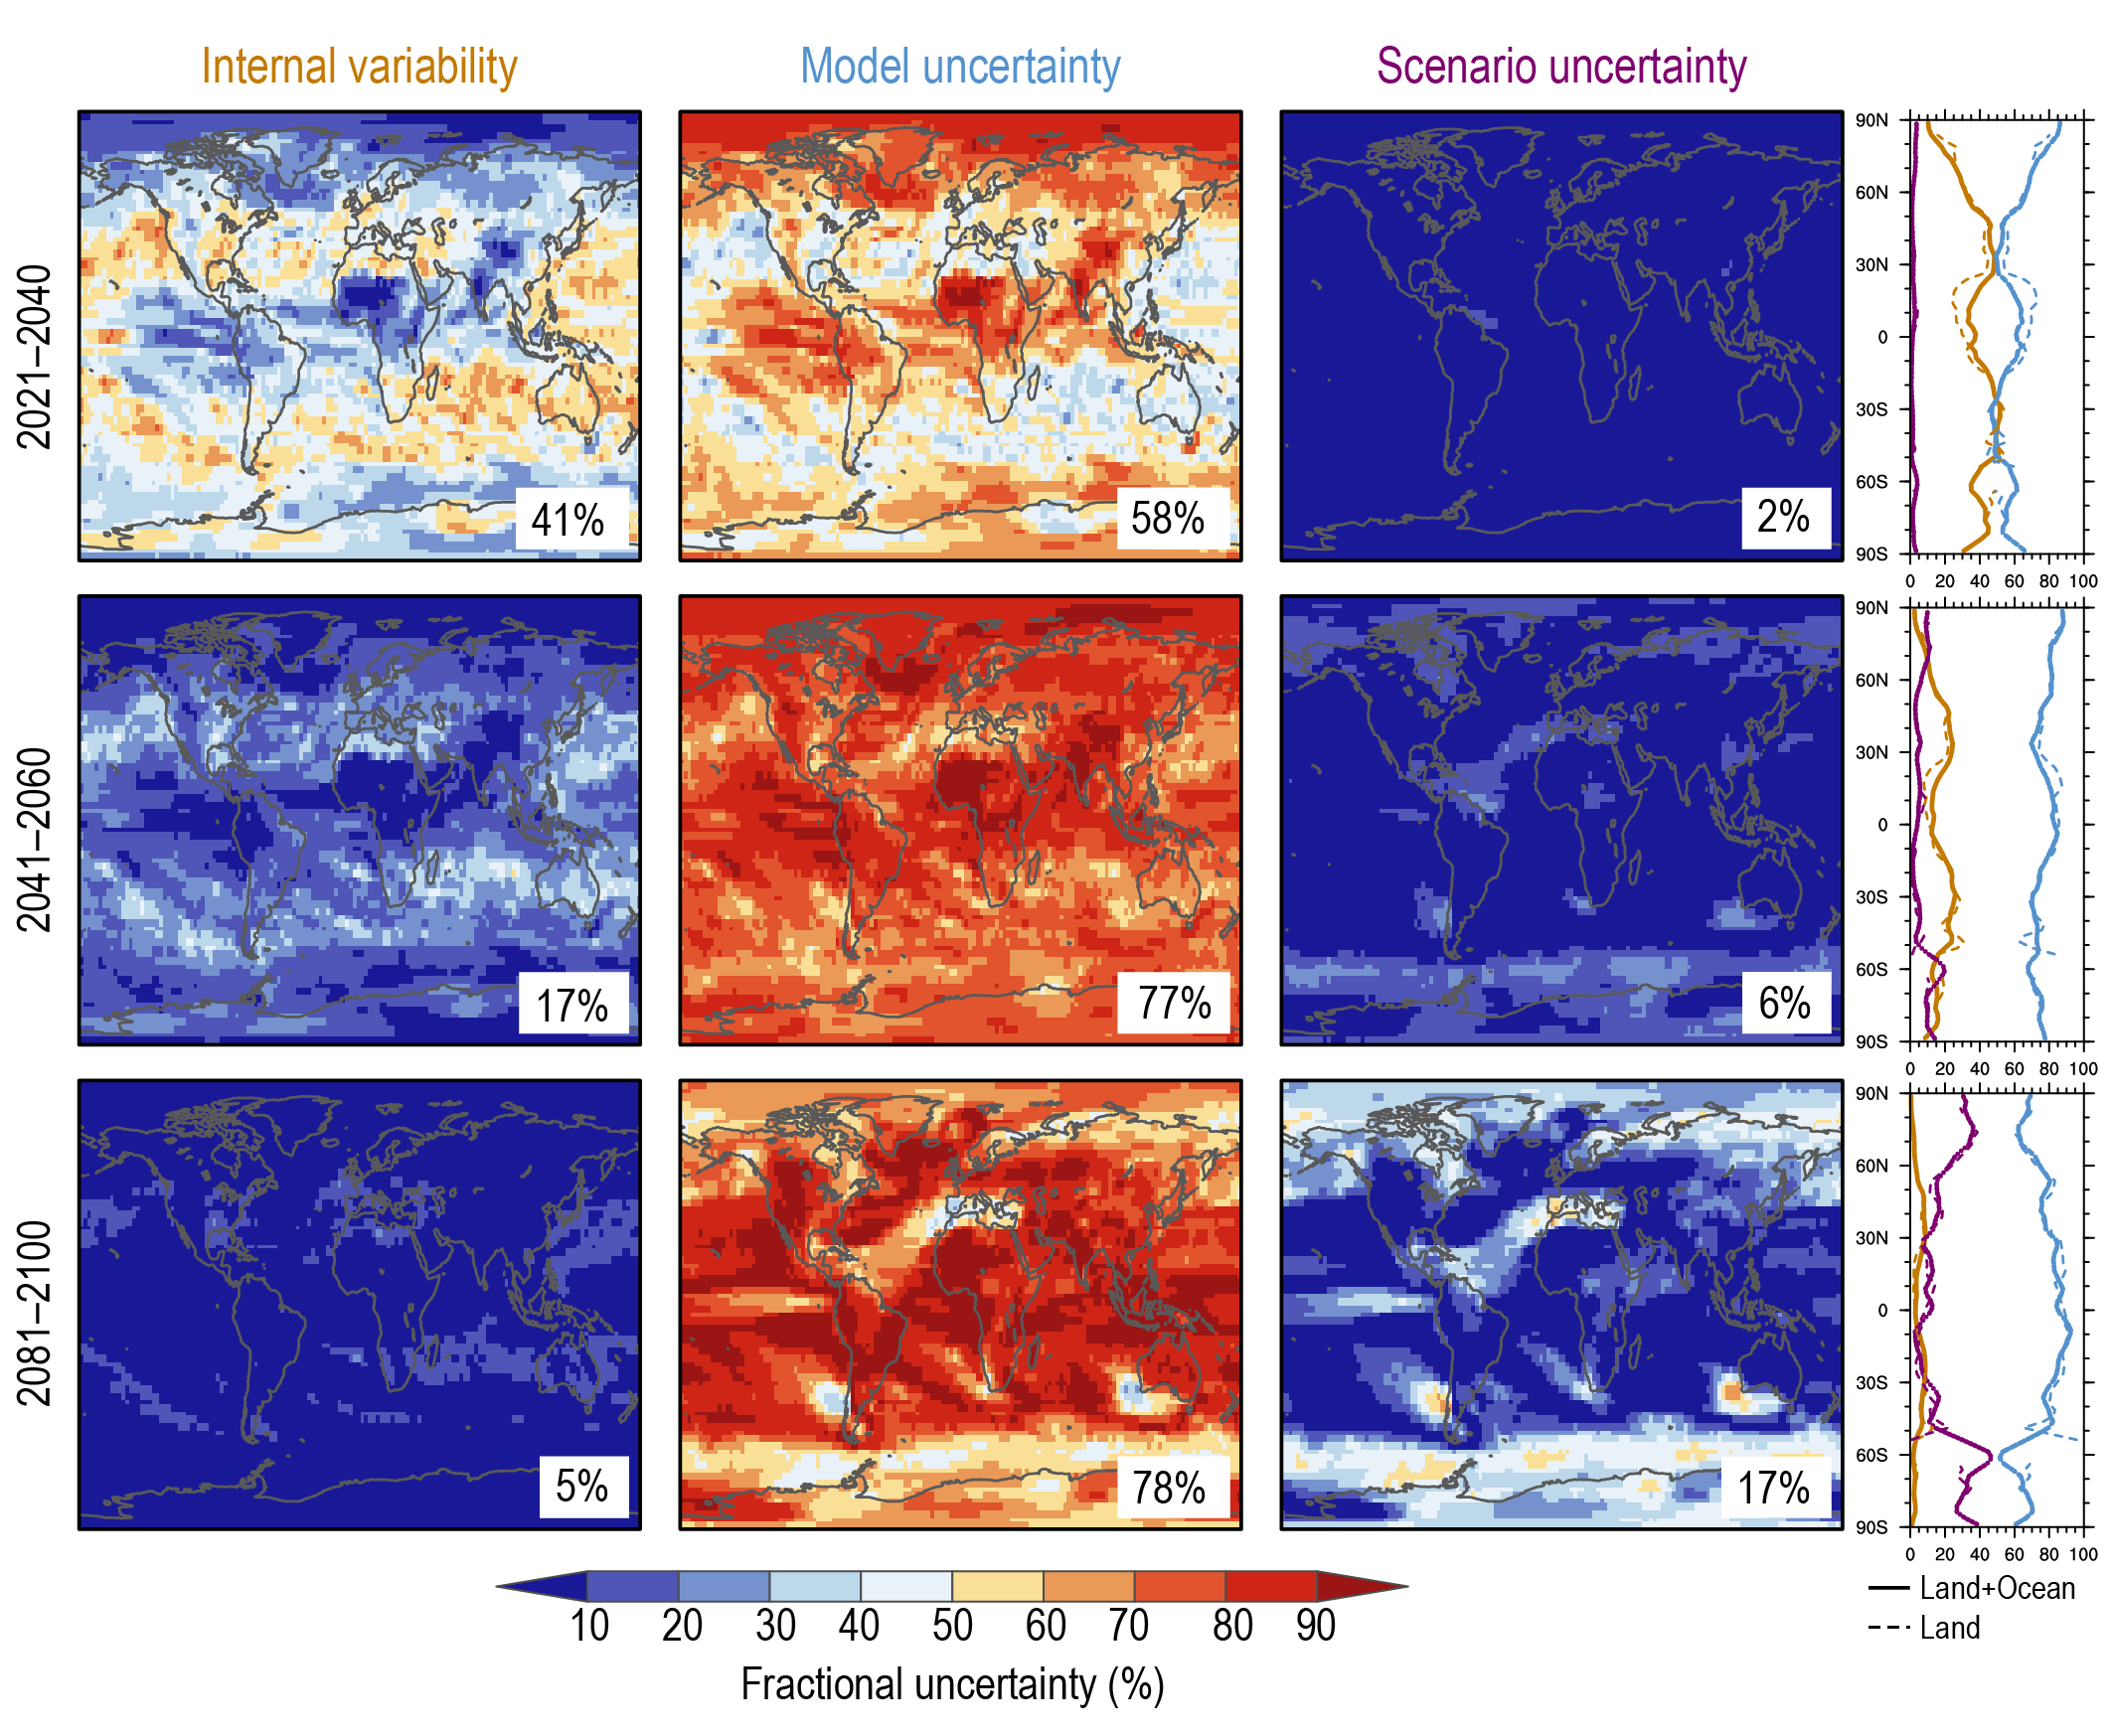
Figure caption
Figure 8.23 | Geographical and zonal mean distribution of the percentage of variance explained by the three sources of uncertainty in CMIP6 projections of 20-year mean precipitation changes in2021–2040 (top), 2041–2060 (middle) and2081–2100 (bottom) relative to the 1995–2014base period: Internal climate variability (left), model response uncertainty (middle) and scenario uncertainty (right, considering four plausible concentration scenarios: SSP1-2.6, SSP2-4.5, SSP3-7.0 and SSP5-8.5). Percentage numbers give the area-weighted global average value for each map. Right panels show the zonal mean fractions over both land and sea (solid lines) and over land only (dashed line). The figure was adapted from Figure 4a in Lehner et al. (2020), https://creativecommons.org/licenses/by/4.0/. The relative contributions of internal variability, models and emissions scenarios to the total uncertainty depend on both region and time horizon. The scenario uncertainty is relatively low in near and mid-term time horizons while it increases in the long term mostly over the high latitudes. The model response uncertainty is the most influential factor across all time horizons. Internal variability also plays a key role in the near term, especially in the subtropics. Further details on data sources and processing are available in the chapter data table (Table 8.SM.1).