Back chapter figures
Figure 8.24
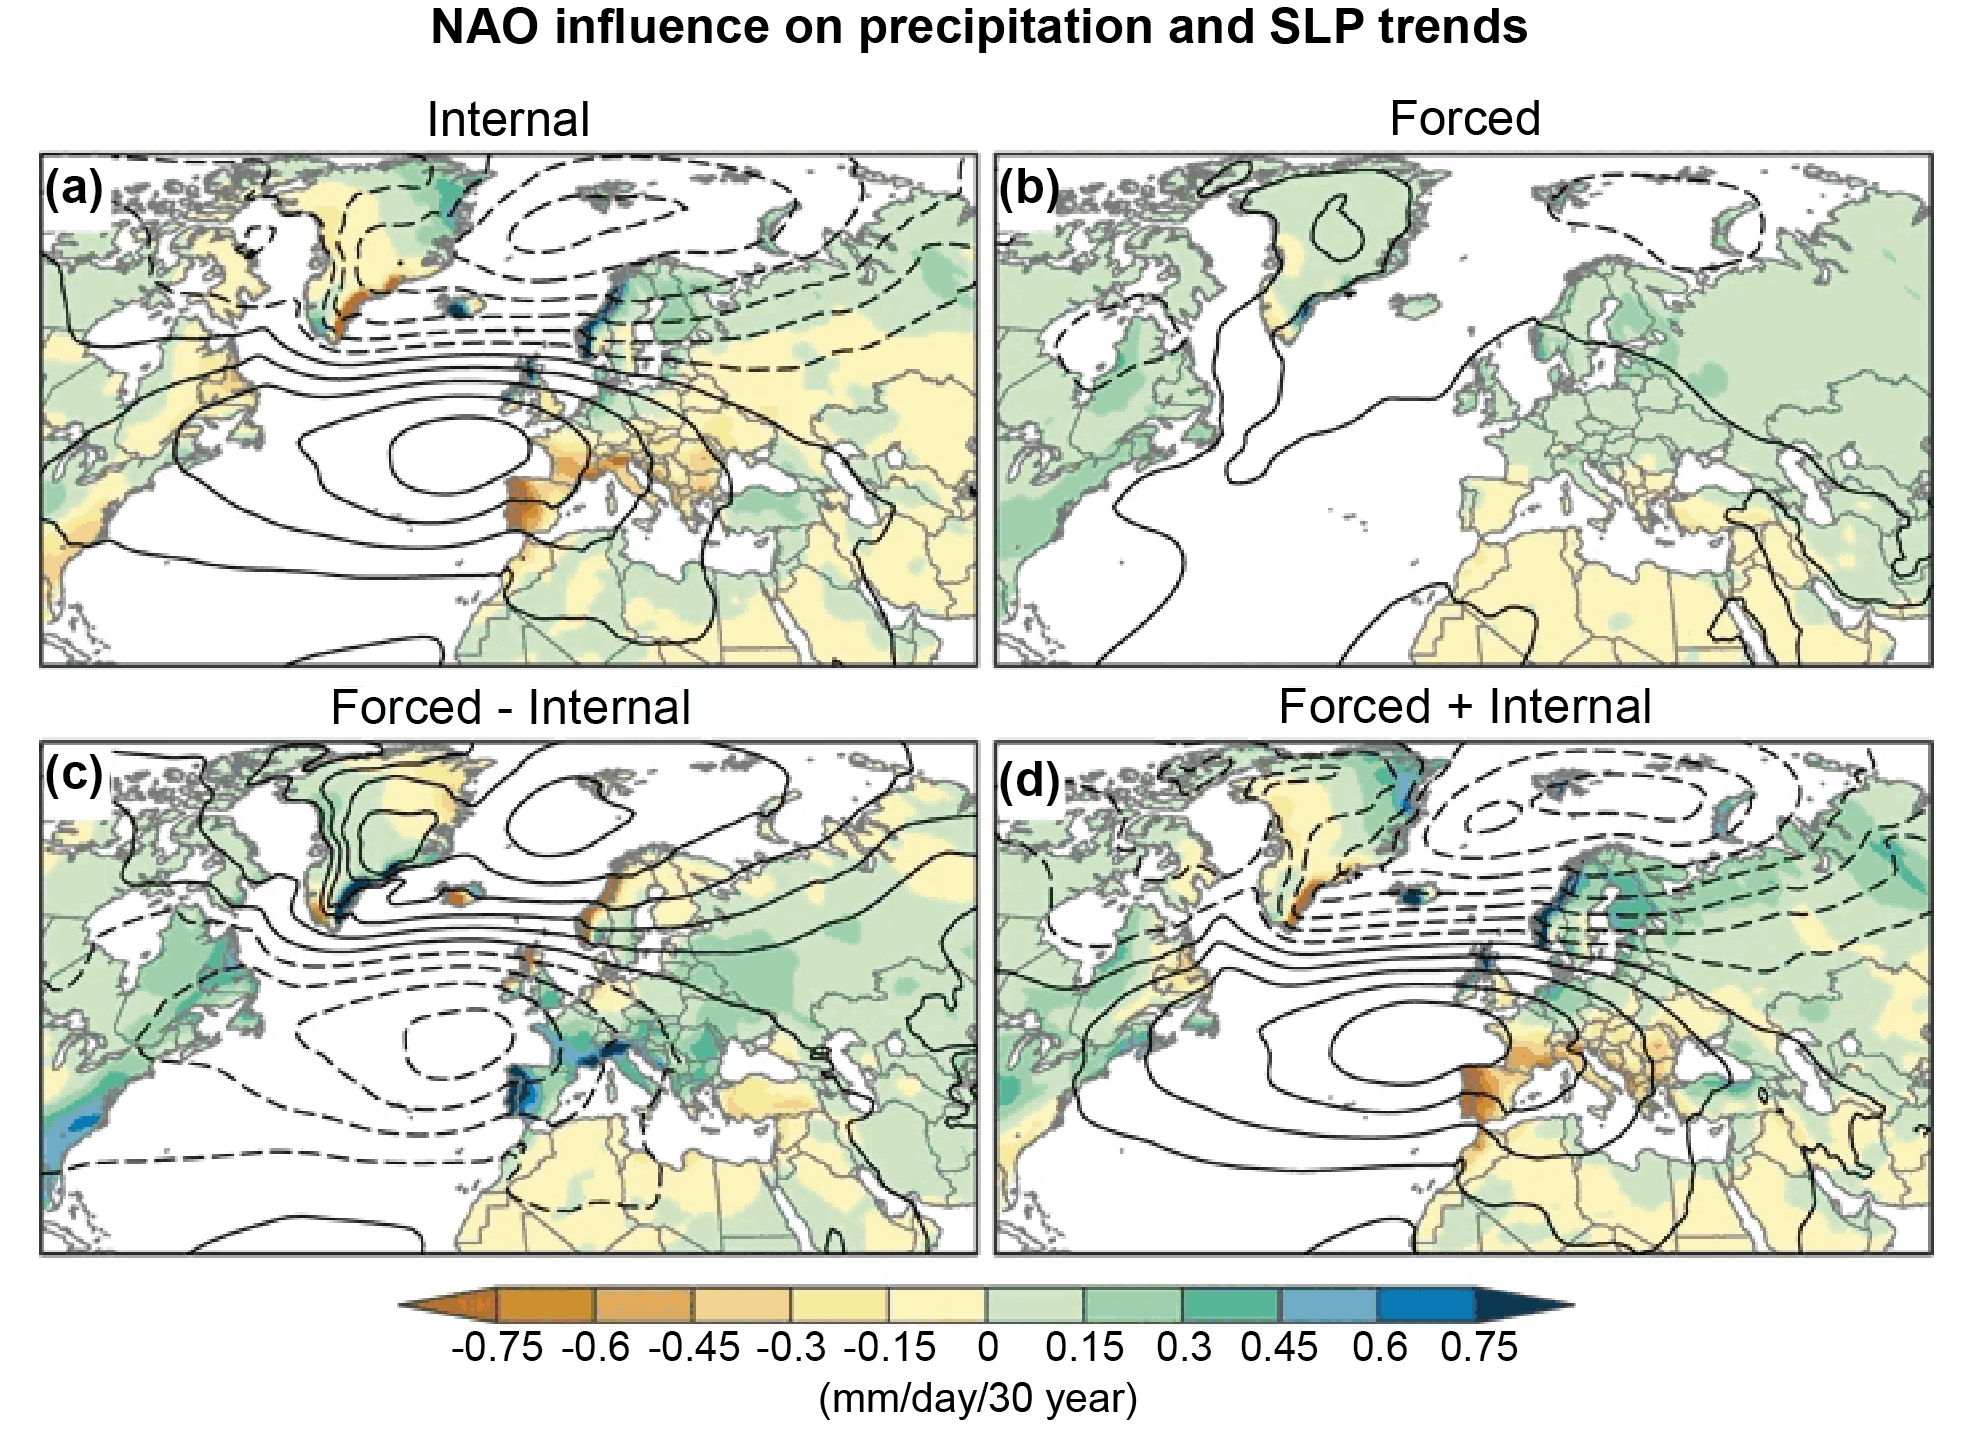
Figure caption
Figure 8.24 | Impact of the North Atlantic Oscillation (NAO) on2016–2045climate trends. (a) Regressions of winter sea level pressure (SLP) and precipitation trends upon the normalized leading principal component (PC) of winter SLP trends in the CESM1 Large Ensemble, multiplied by two to correspond to a two standard deviation anomaly of the PC (as internal climate variability component); (b) CESM1 ensemble-mean winter SLP and precipitation trends (as forced climate variability component); (c) b – a (forced minus internal climate variability component); (d) b + a (forced plus internal climate variability component). Precipitation in colour shading (mm day–1 per 30 years) and SLP in contours (interval = 1 hPa per 30 years with negative values dashed). Figure adapted from Deser et al. (2017), https://creativecommons.org/licenses/by/4.0/; further details on data sources and processing are available in the chapter data table (Table 8.SM.1).