Back chapter figures
Figure 8.4
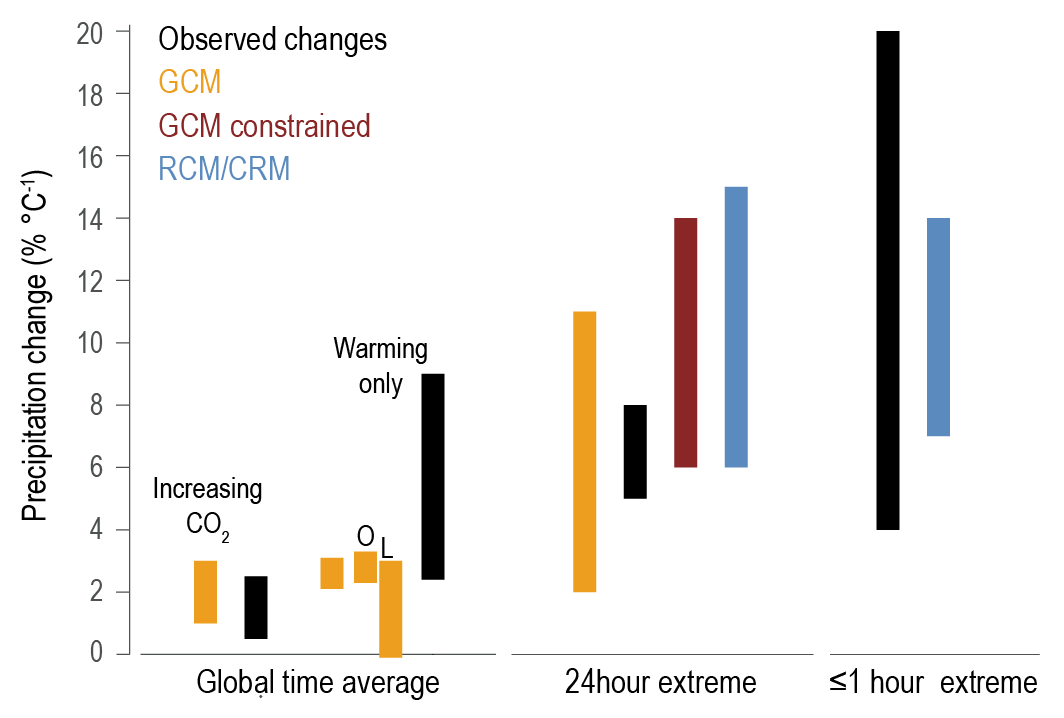
Figure caption
Figure 8.4 | Estimate (5–95% range) of the increase in precipitation and its extremes with global mean surface warming. Global time-averaged precipitation changes (left) are based on responses to increasing CO2 (apparent hydrological sensitivity, ηa) and the temperature-dependent component (hydrological sensitivity, η), both of which are based on GCM experiments; the land (L) and ocean (O) components (Fläschner et al., 2016; T.B. Richardson et al., 2018a; Samset et al., 2018a; Pendergrass, 2020b; Rehfeld et al., 2020) and observational estimates (GPCP/HadCRUTv4.6) use trends (1988–2014) as a proxy forηa and interannual variability as a proxy forη, with 90% confidence range accounting for statistical uncertainty only (Adler et al., 2017; Allan et al., 2020). For extreme precipitation, assessment is for 24 hour, 99.9th percentile or annual maximum extremes from GCMs (Fischer and Knutti, 2015; Pendergrass et al., 2015; Borodina et al., 2017; Pfahl et al., 2017; Sillmann et al., 2017), regional climate models (RCMs) (Bao et al., 2017), an observationally-constrained tropical estimate (O’Gorman, 2012) and estimates from observed changes (Westra et al., 2013; Donat et al., 2016; Borodina et al., 2017; Zeder and Fischer, 2020; Sun et al., 2021). For hourly and sub-hourly extremes observed changes (Barbero et al., 2017; Guerreiro et al., 2018) and high-resolution models, including RCM and cloud-resolving models (CRMs) are assessed (Ban et al., 2015; Prein et al., 2017; Haerter and Schlemmer, 2018; Hodnebrog et al., 2019a; Lenderink et al., 2019). Further details on data sources and processing are available in the chapter data table (Table 8.SM.1).