Back chapter figures
Figure 8.7
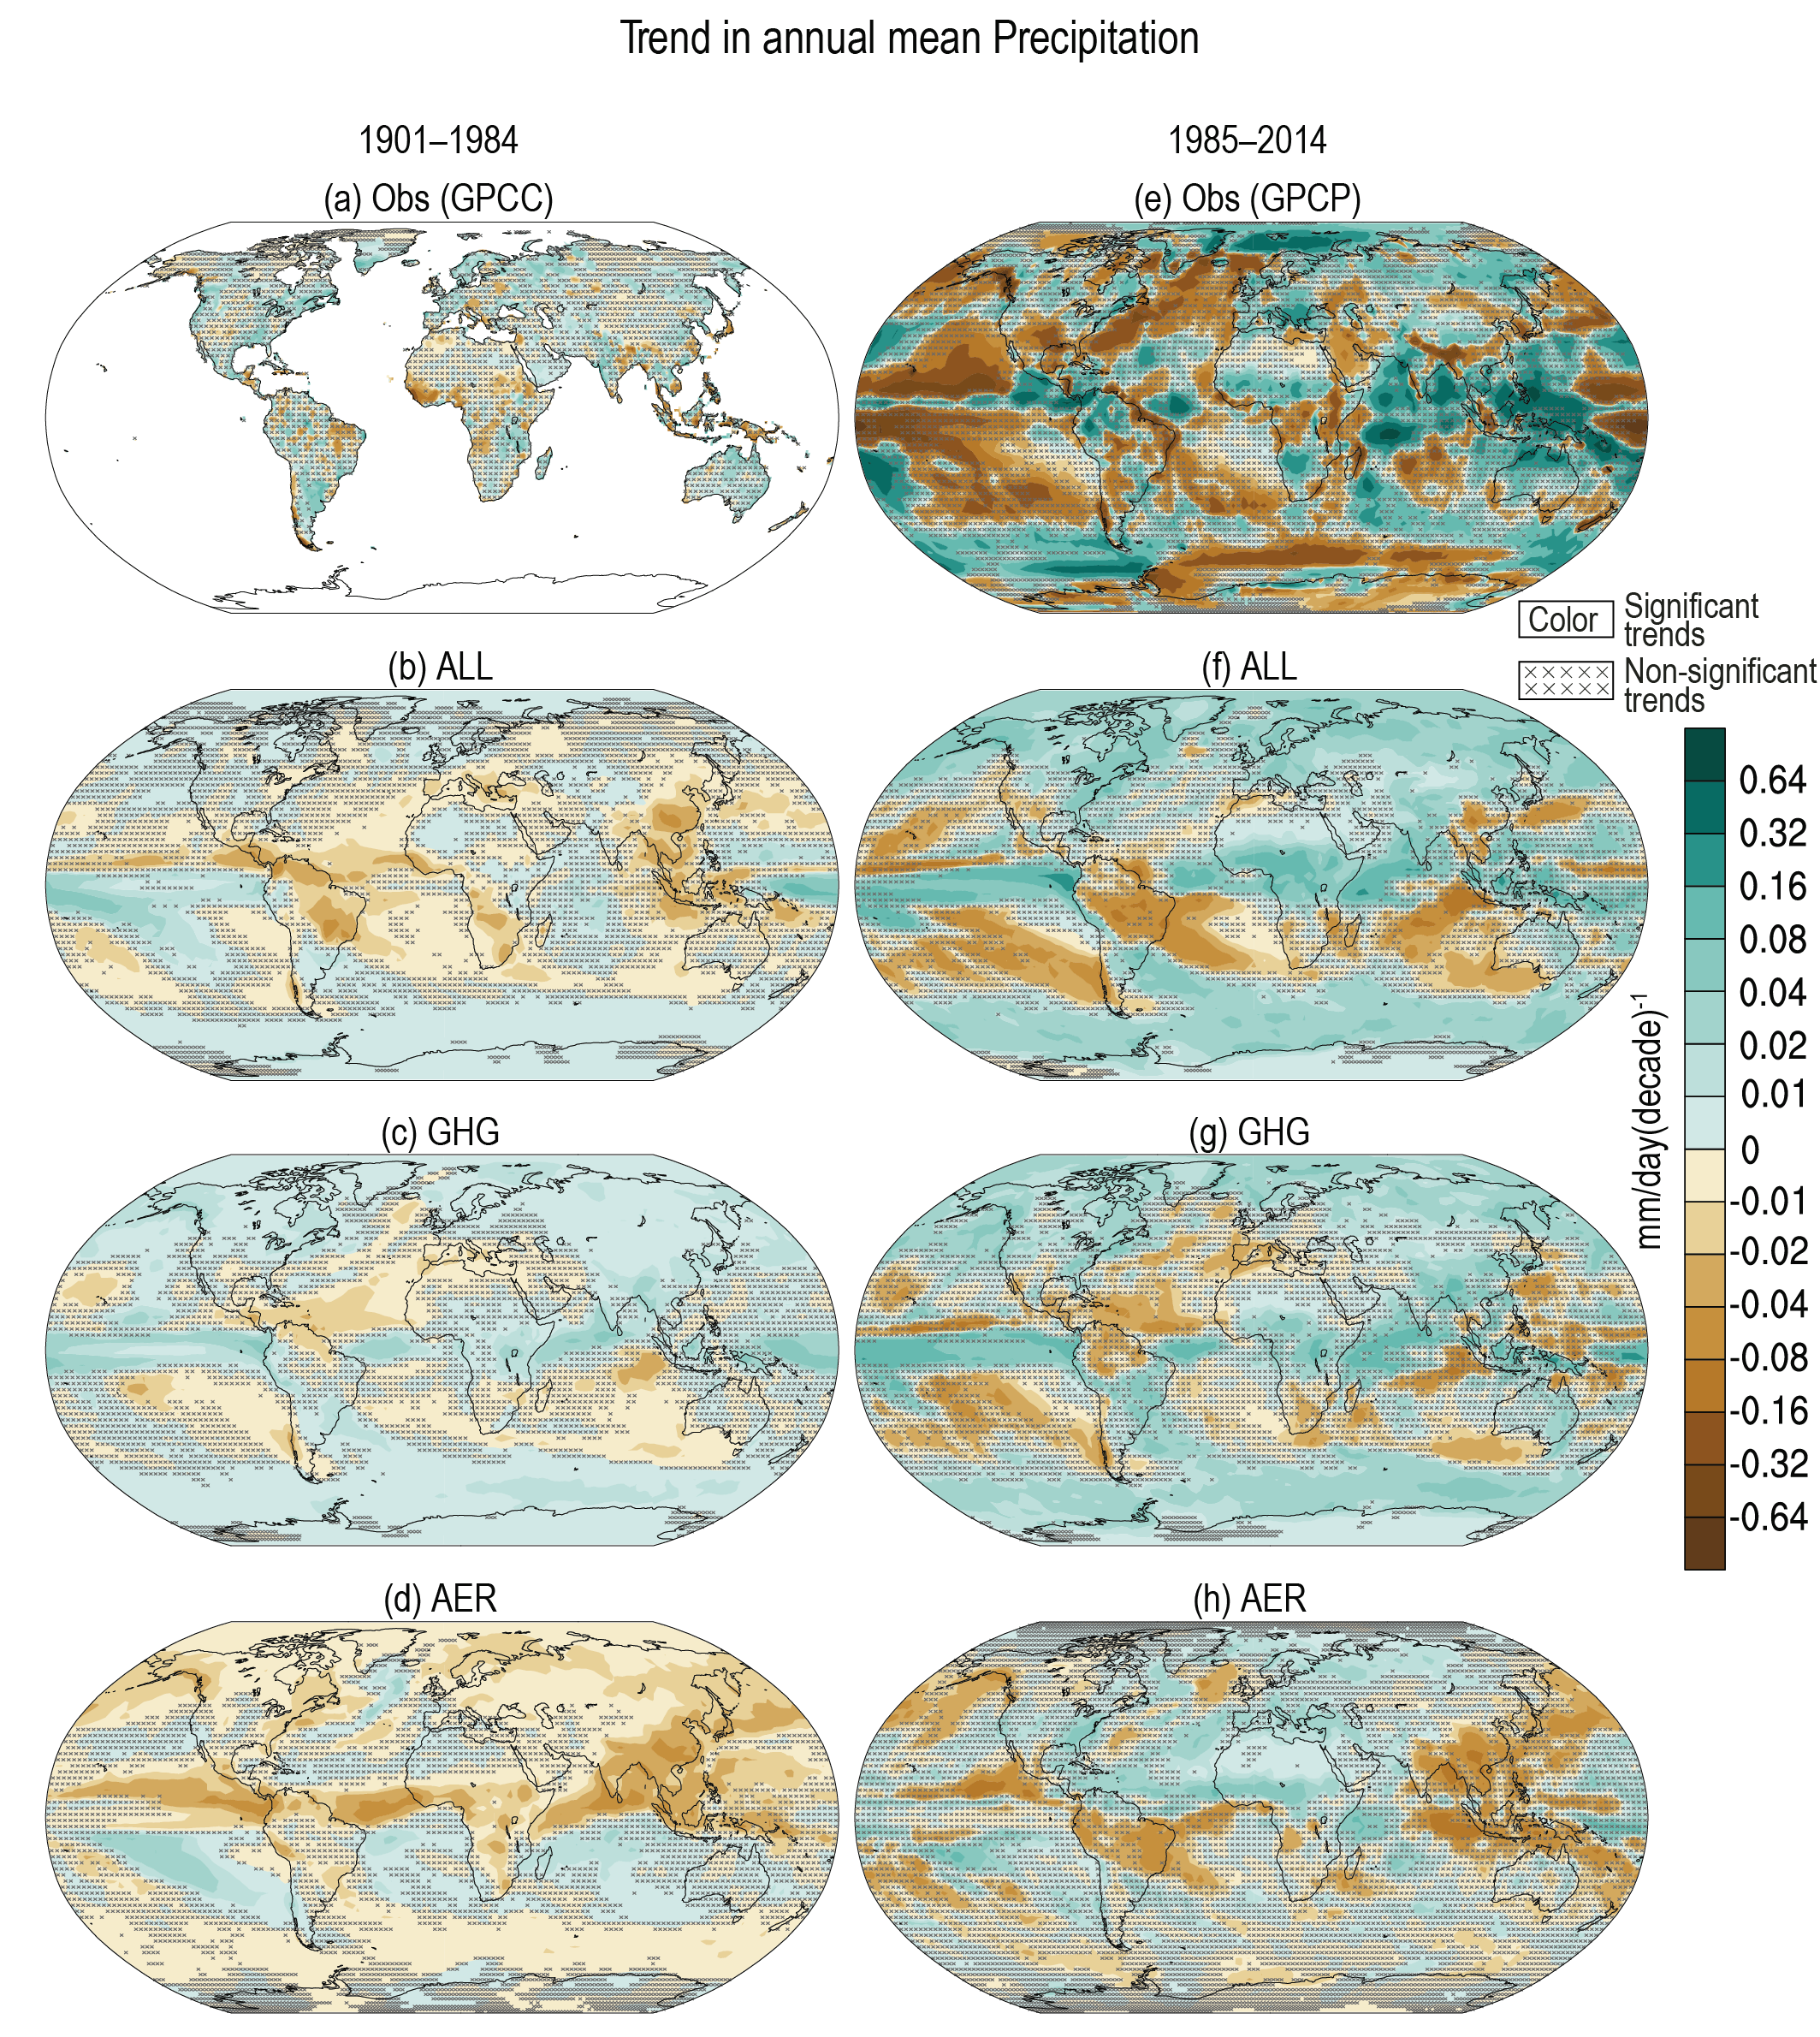
Figure caption
Figure 8.7 | Linear trends in annual mean precipitation (mm day–1per decade) for 1901–1984 (left) and 1985–2014 (right): (a, e) observational dataset, and the CMIP6 multi-model ensemble mean historical simulations driven by: (b, f) all radiative forcings; (c, g) GHG-only radiative forcings; (d, h) aerosol-only radiative forcings experiment. Colour shades without grey cross correspond to the regions exceeding 10% significant level. Grey crosses correspond to the regions not reaching the 10% statistically significant level. Nine CMIP6-DAMIP models have been used having at least three members. The ensemble mean is weighted per each model on the available and used members. Further details on data sources and processing are available in the chapter data table (Table 8.SM.1).