Back chapter figures
Figure 8.8
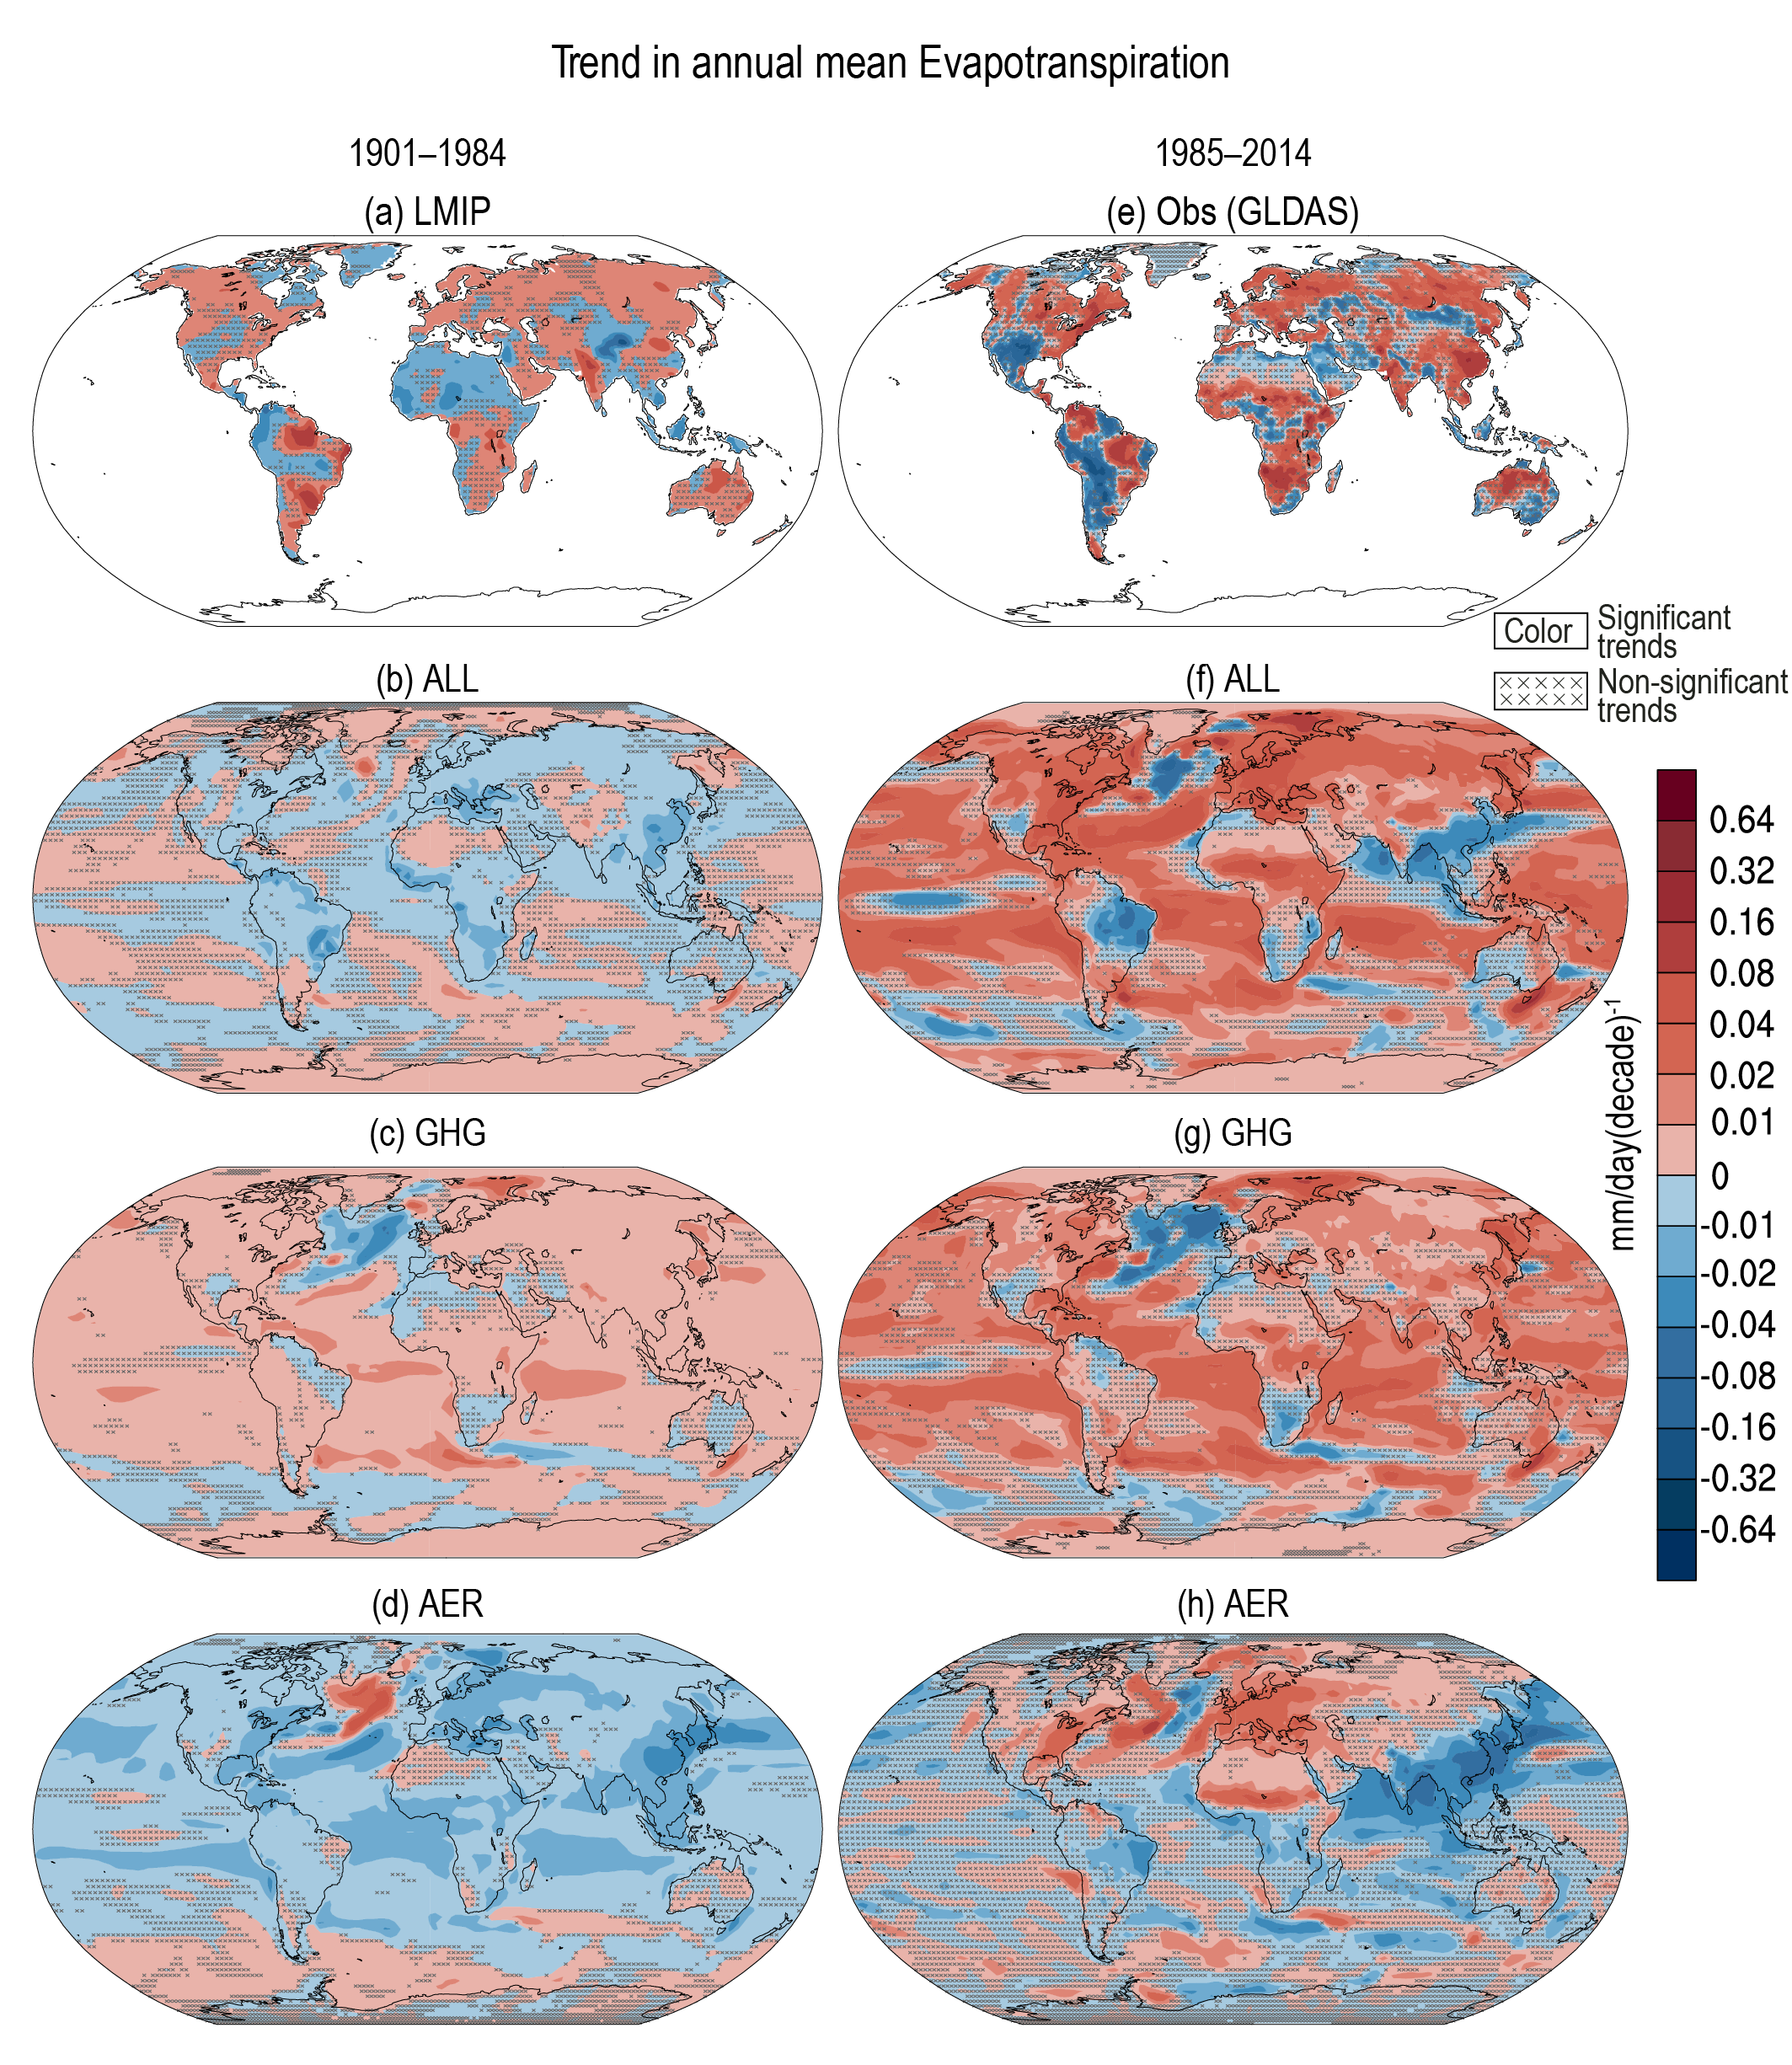
Figure caption
Figure 8.8 | Linear trends in annual mean evapotranspiration (mm day–1 per decade) for1901–1984 (left) and 1985–2014 (right): (a, e) Land Model Intercomparison Project (LMIP) and observational dataset, and the CMIP6 multi-model ensemble mean historical simulations driven by (b, f) all radiative forcings, (c, g) GHG-only radiative forcings, (d, h) aerosol-only radiative forcings experiment. Colour shade without grey cross correspond to the regions exceeding 10% significant level. Grey crosses correspond to the regions not reaching the 10% statistically significant level. Nine CMIP6-DAMIP models have been used having at least three members. The ensemble mean is weighted per each model on the available and used members. The Global Land Data Assimilation System (GLDAS) was not available over the early 20th century so was replaced by a multi-model off-line reconstruction, LMIP, which is consistent with GLDAS over the recent period but may be less reliable over the early 20th century given larger uncertainties in the atmospheric forcings. Further details on data sources and processing are available in the chapter data table (Table 8.SM.1).