Back chapter figures
Figure 8.9
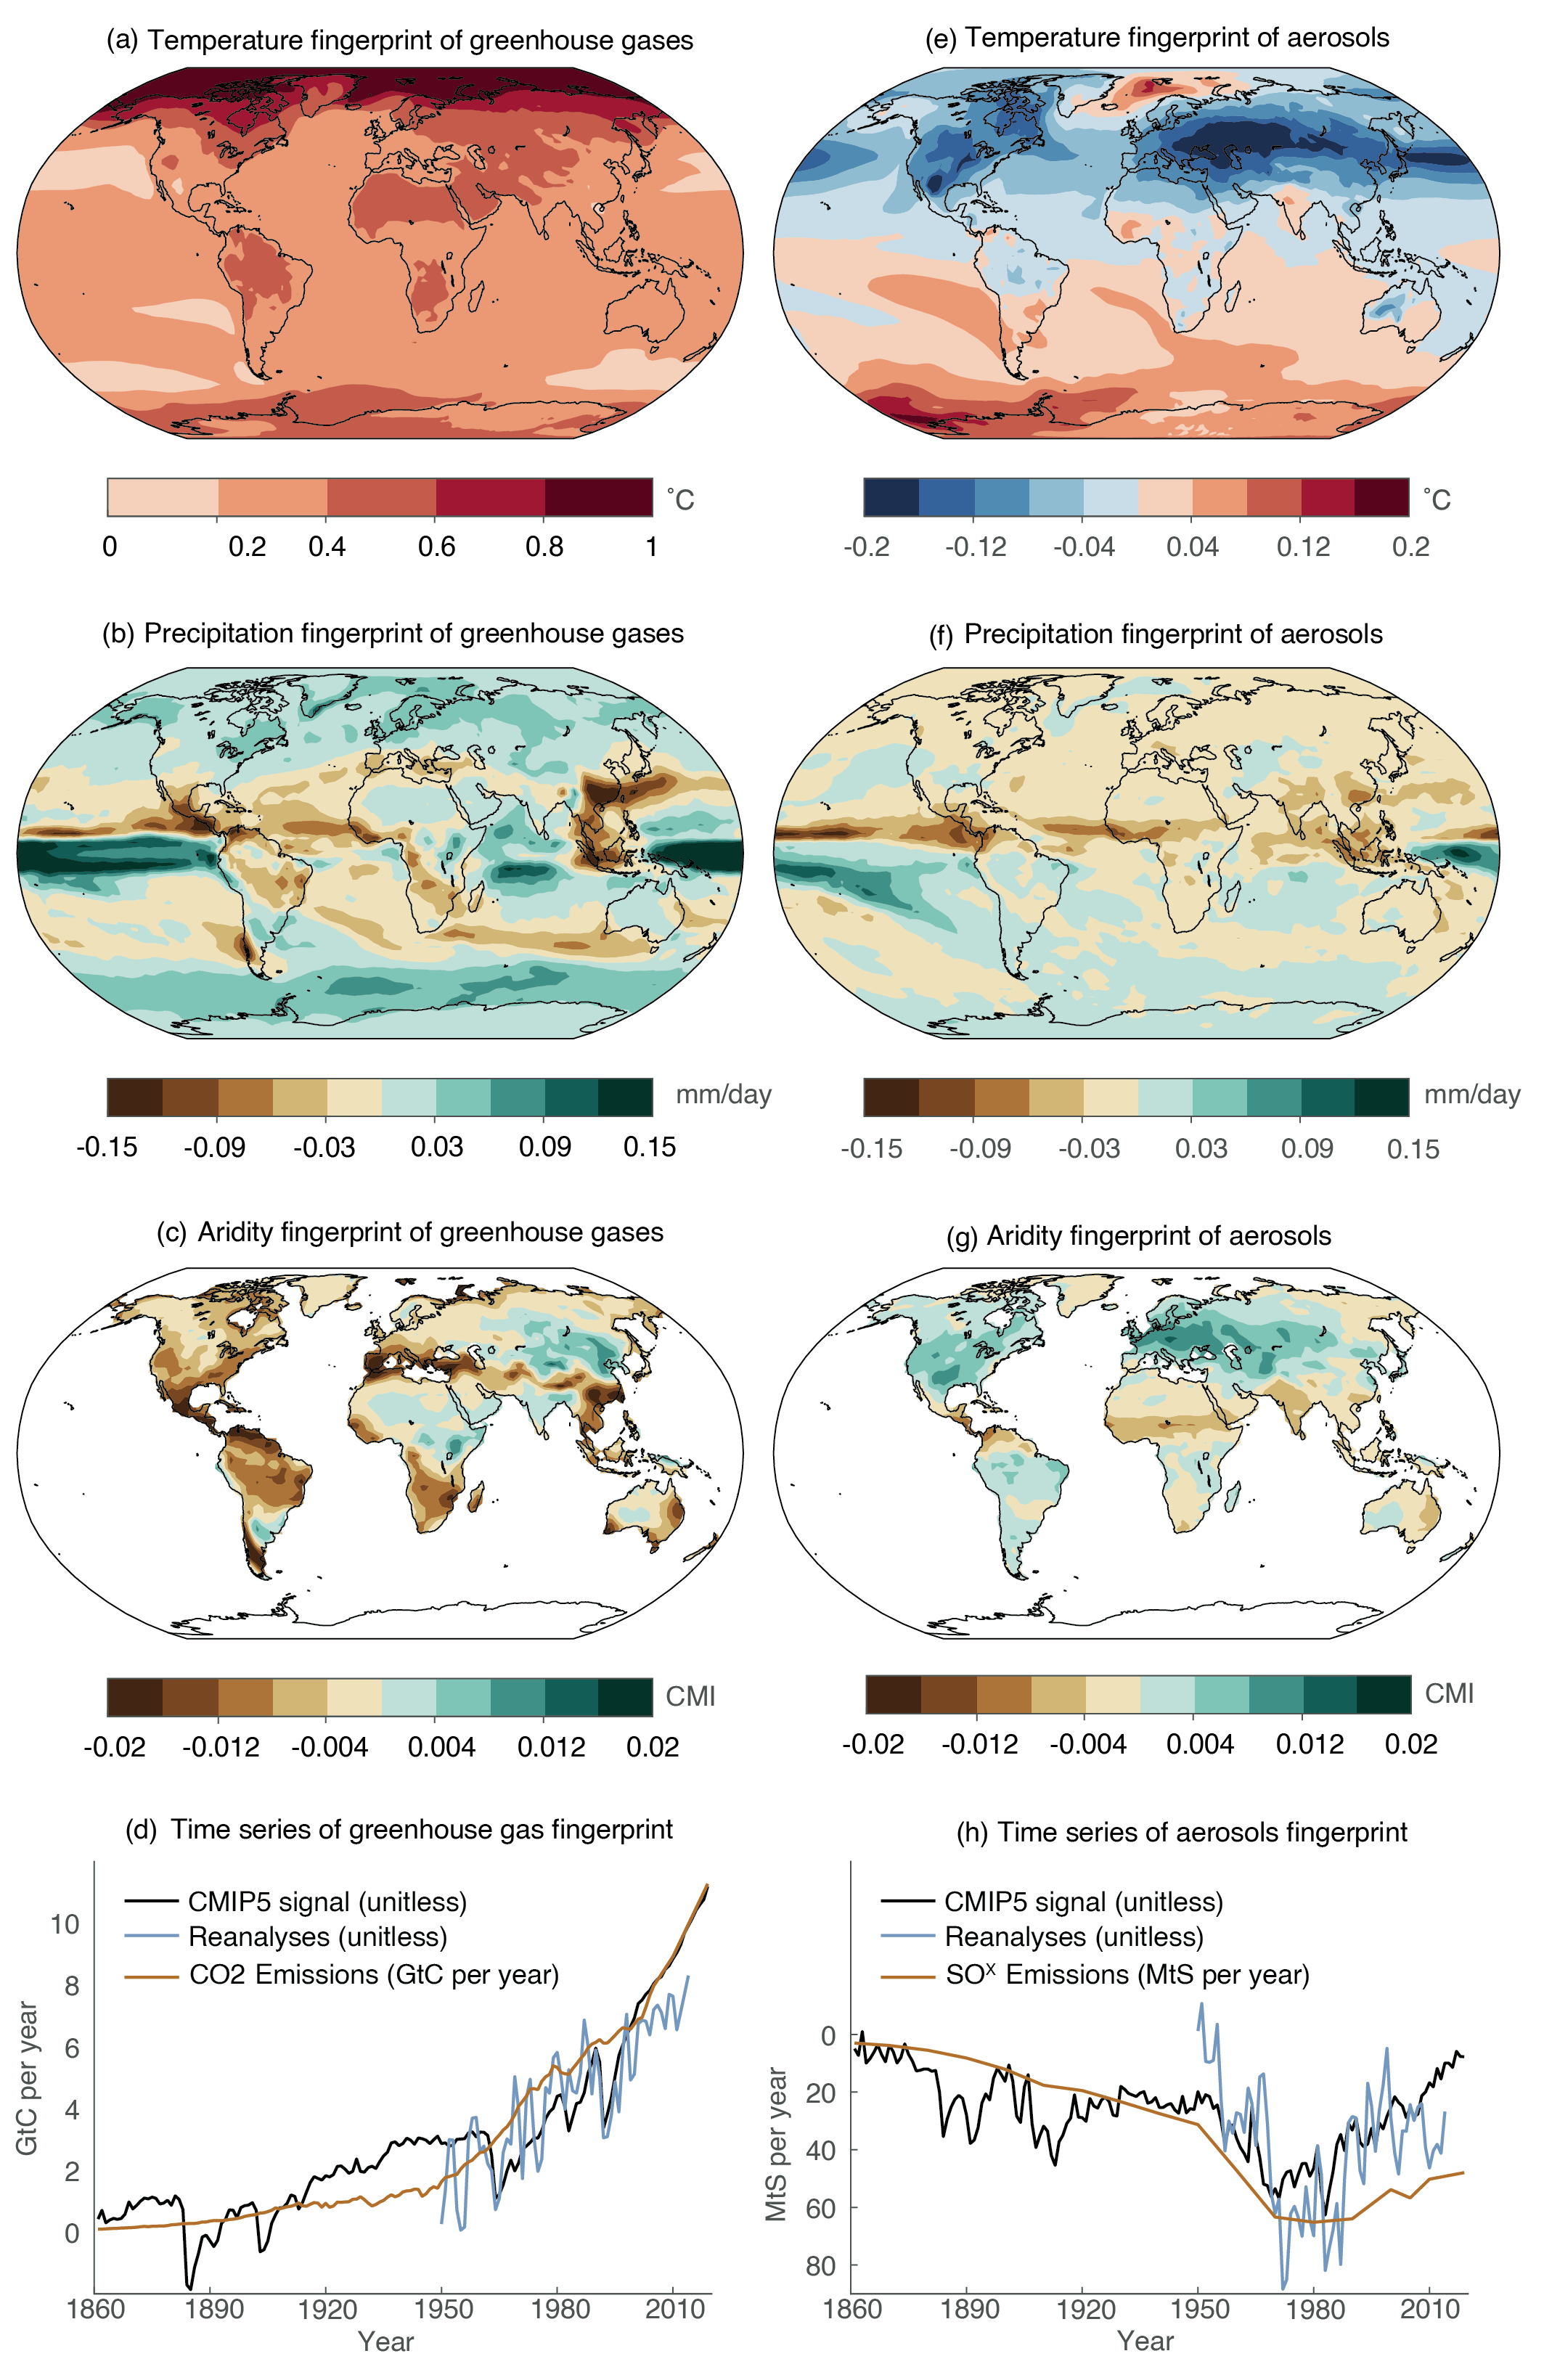
Figure caption
Figure 8.9 | Spatial expressions (a–c, e–g) of the leading multivariate fingerprints of temperature (°C), precipitation (mm day–1), and aridity (CMI; the Climate Moisture Index) in CMIP5 historical simulations and the corresponding temporal evolution in both CMIP5 and reanalysis products (d, h).
The first leading fingerprint is associated with greenhouse gas forcing (a–d) and the second leading fingerprint is associated with aerosol forcing (e–h). CMI is a dimensionless aridity indicator that combines precipitation and atmospheric evaporative demand. Figure after Bonfils et al. (2020). Further details on data sources and processing are available in the chapter data table (Table 8.SM.1).