Box 9.2 Figure 1
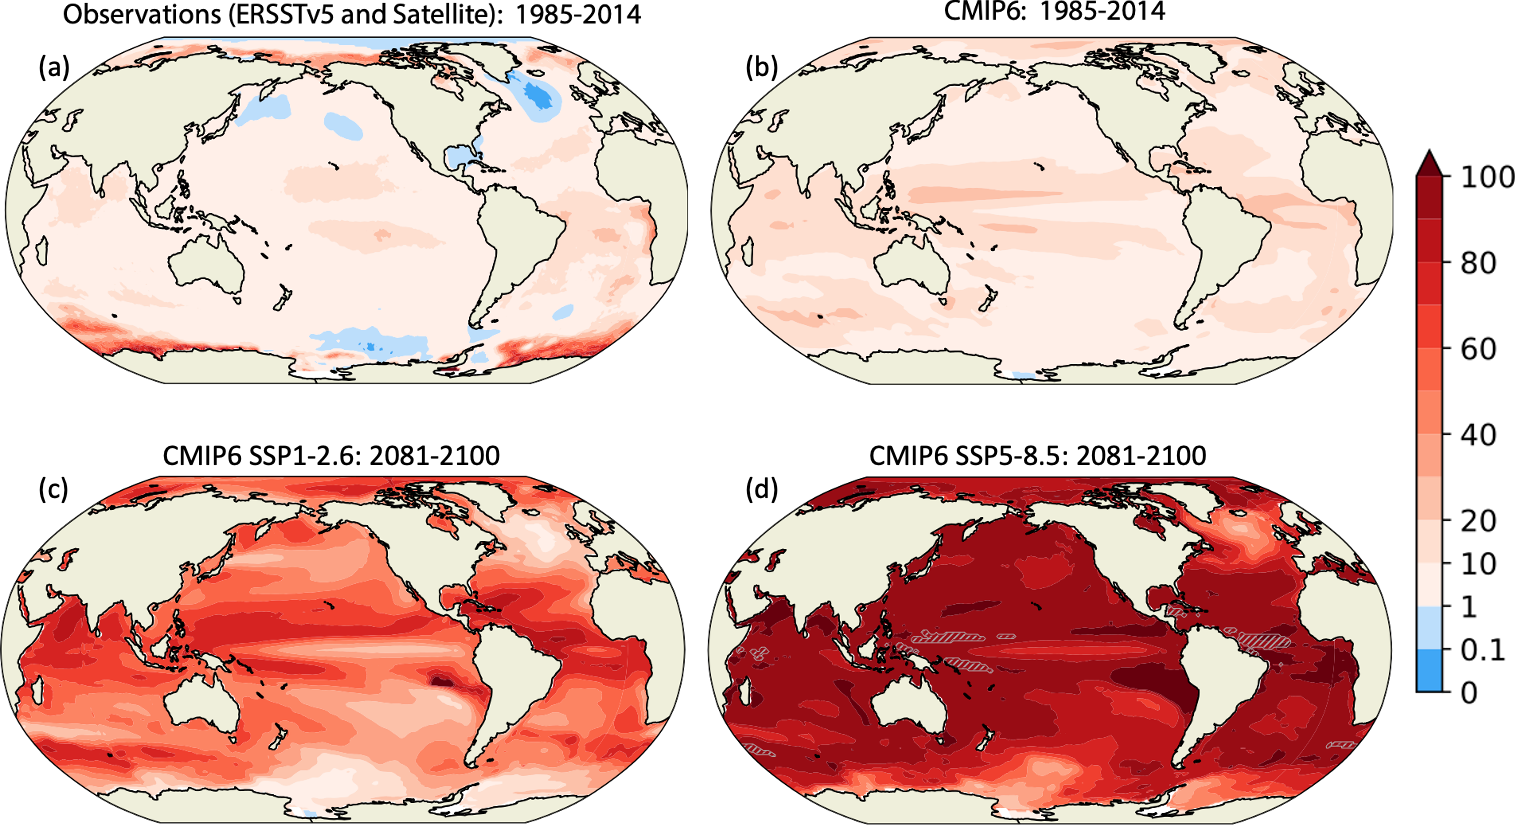
Figure caption
Box 9.2, Figure 1 | Observed and simulated regional probability ratio of marine heatwaves (MHWs) for the 1985–2014 period and for the end of the 21st century under two different greenhouse gas emissions scenarios. The probability ratio is the proportion by which the number of MHW days per year has increased relative to pre-industrial times. An MHW is defined as a deviation beyond the daily 99th percentile (11-day window) in the deseasonalized sea surface temperature. (a) The MHW probability ratio from satellite observations (NOAA OISST V2.1; Huang et al. 2020) during 1985–2014. The mean warming pattern (difference in ERSST5 (Huang et al. 2017) sea surface temperature between the 1985–2014 and 1854–1900 periods) has been added to the satellite observations to calculate the probability ratio. (b–d) Coupled Model Intercomparison Project Phase 6 (CMIP6) simulated multi-model mean probability ratio of The (b) 1985–2014 period, and 2081–2100 period in The (c) SSP1 2.6 and (d) SSP5 8.5 scenarios. The areas with grey diagonal lines in (d) indicate permanent MHWs (>360 heatwave days per year). These 14 CMIP6 models are included in the analysis: ACCESS-CM2, CESM2, CESM2-WACCM, CMCCCM2-SR5, CNRM-CM6-1, CNRM-ESM2-1, CanESM5, EC-Earth3, IPSL-CM6A-LR, MIROC6, MRI-ESM2-0, NESM3, NorESM2-LM, NorESM2-MM. Further details on data sources and processing are available in the chapter data table (Table 9.SM.9).