Cross-Chapter Box 9.1, Figure 1
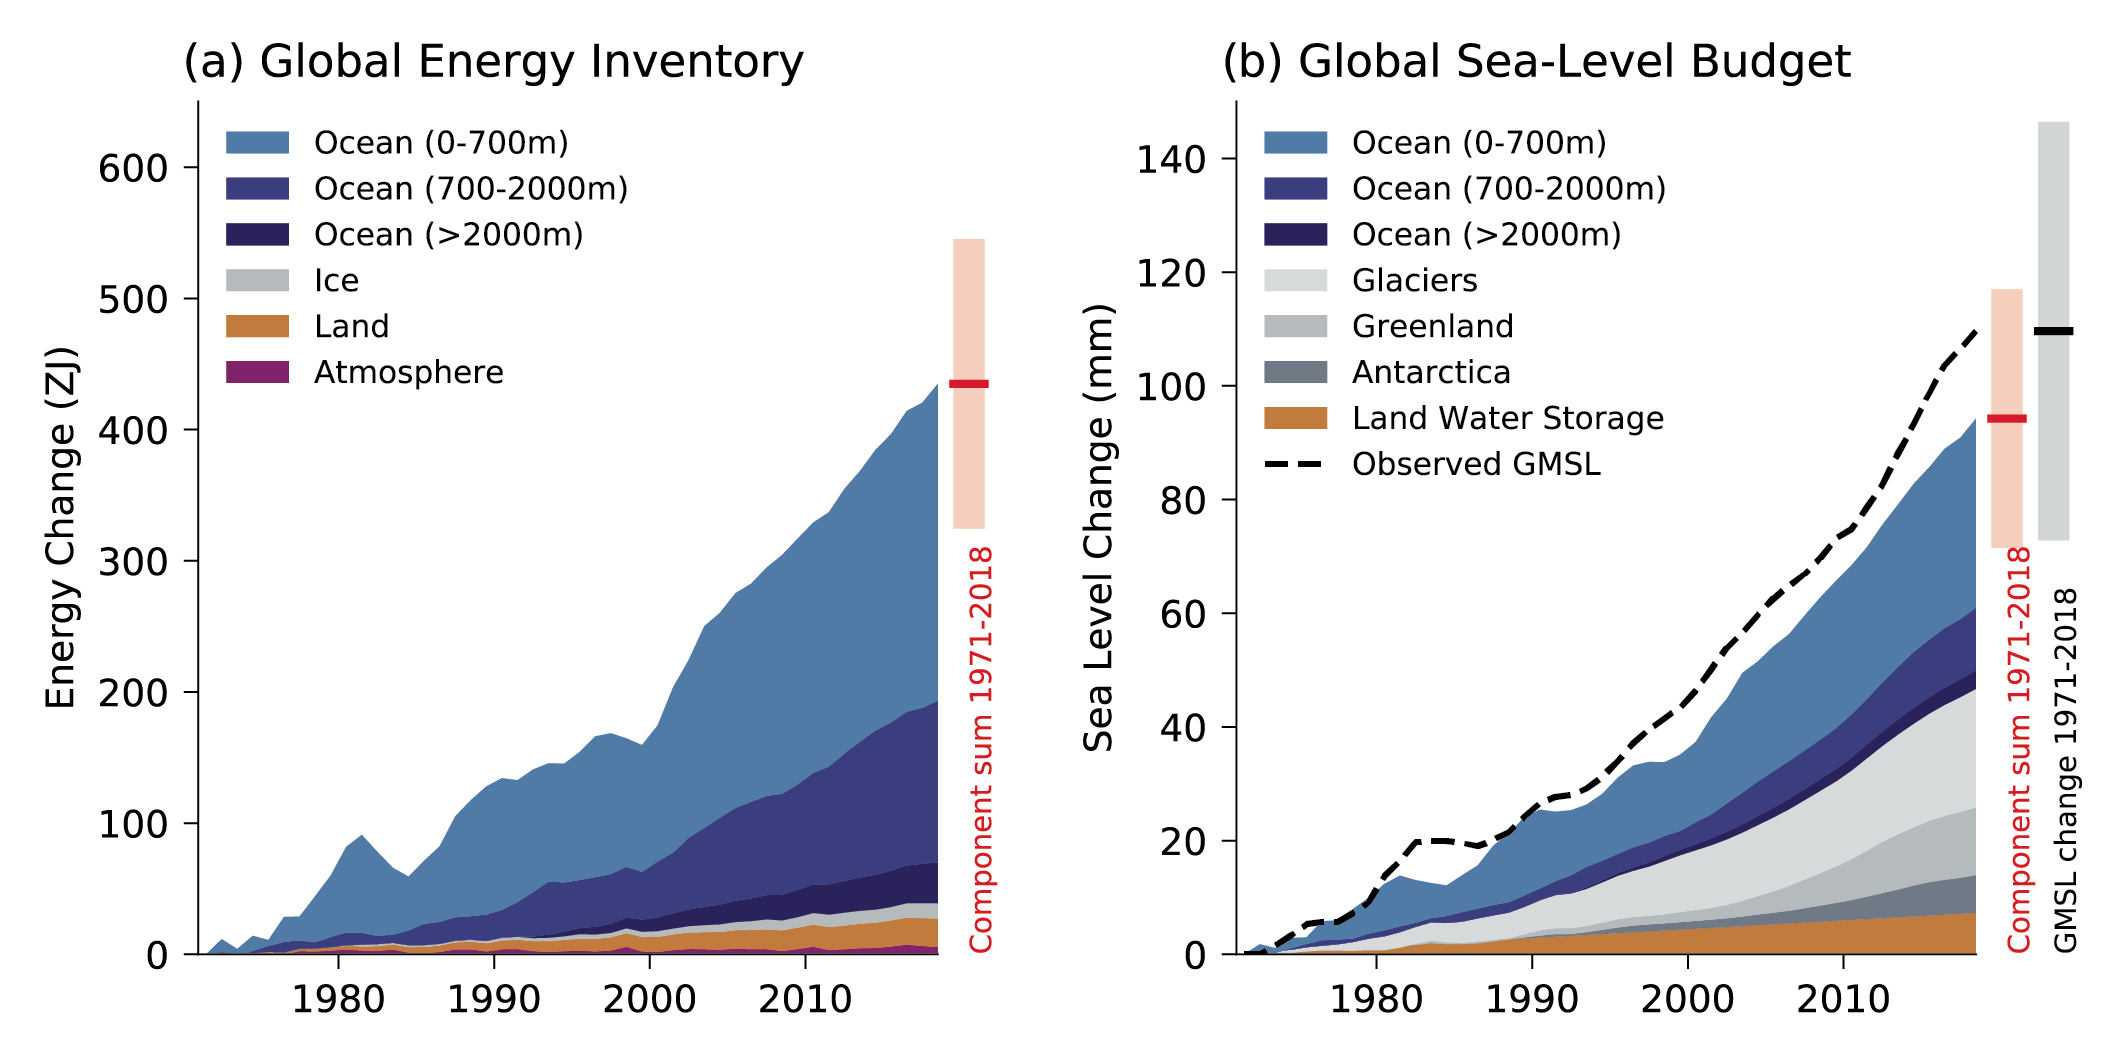
Figure caption
Cross-Chapter 9.1, Figure 1 | Global Energy Inventory and Sea Level Budget. (a) Observed changes in the global energy inventory for 1971–2018 (shaded time series) with component contributions as indicated in the figure legend. Earth System Heating for the whole period and associated uncertainty is indicated to the right of the plot (red bar = central estimate; shading =very likely range); (b) Observed changes in components of global mean sea level for 1971–2018 (shaded time series) as indicated in the figure legend. Observed global mean sea level change from tide gauge reconstructions (1971–1993) and satellite altimeter measurements (1993–2018) is shown for comparison (dashed line) as a three-year running mean to reduce sampling noise. Closure of the global sea level budget for the whole period is indicated to the right of the plot (red bar = component sum central estimate; red shading =very likely range; black bar = total sea level central estimate; grey shading =very likely range). Full details of the datasets and methods used are available in Annex I. Further details on energy and sea level components are reported in Table 7.1 and Table 9.5.