Back chapter figures
Figure 9.10
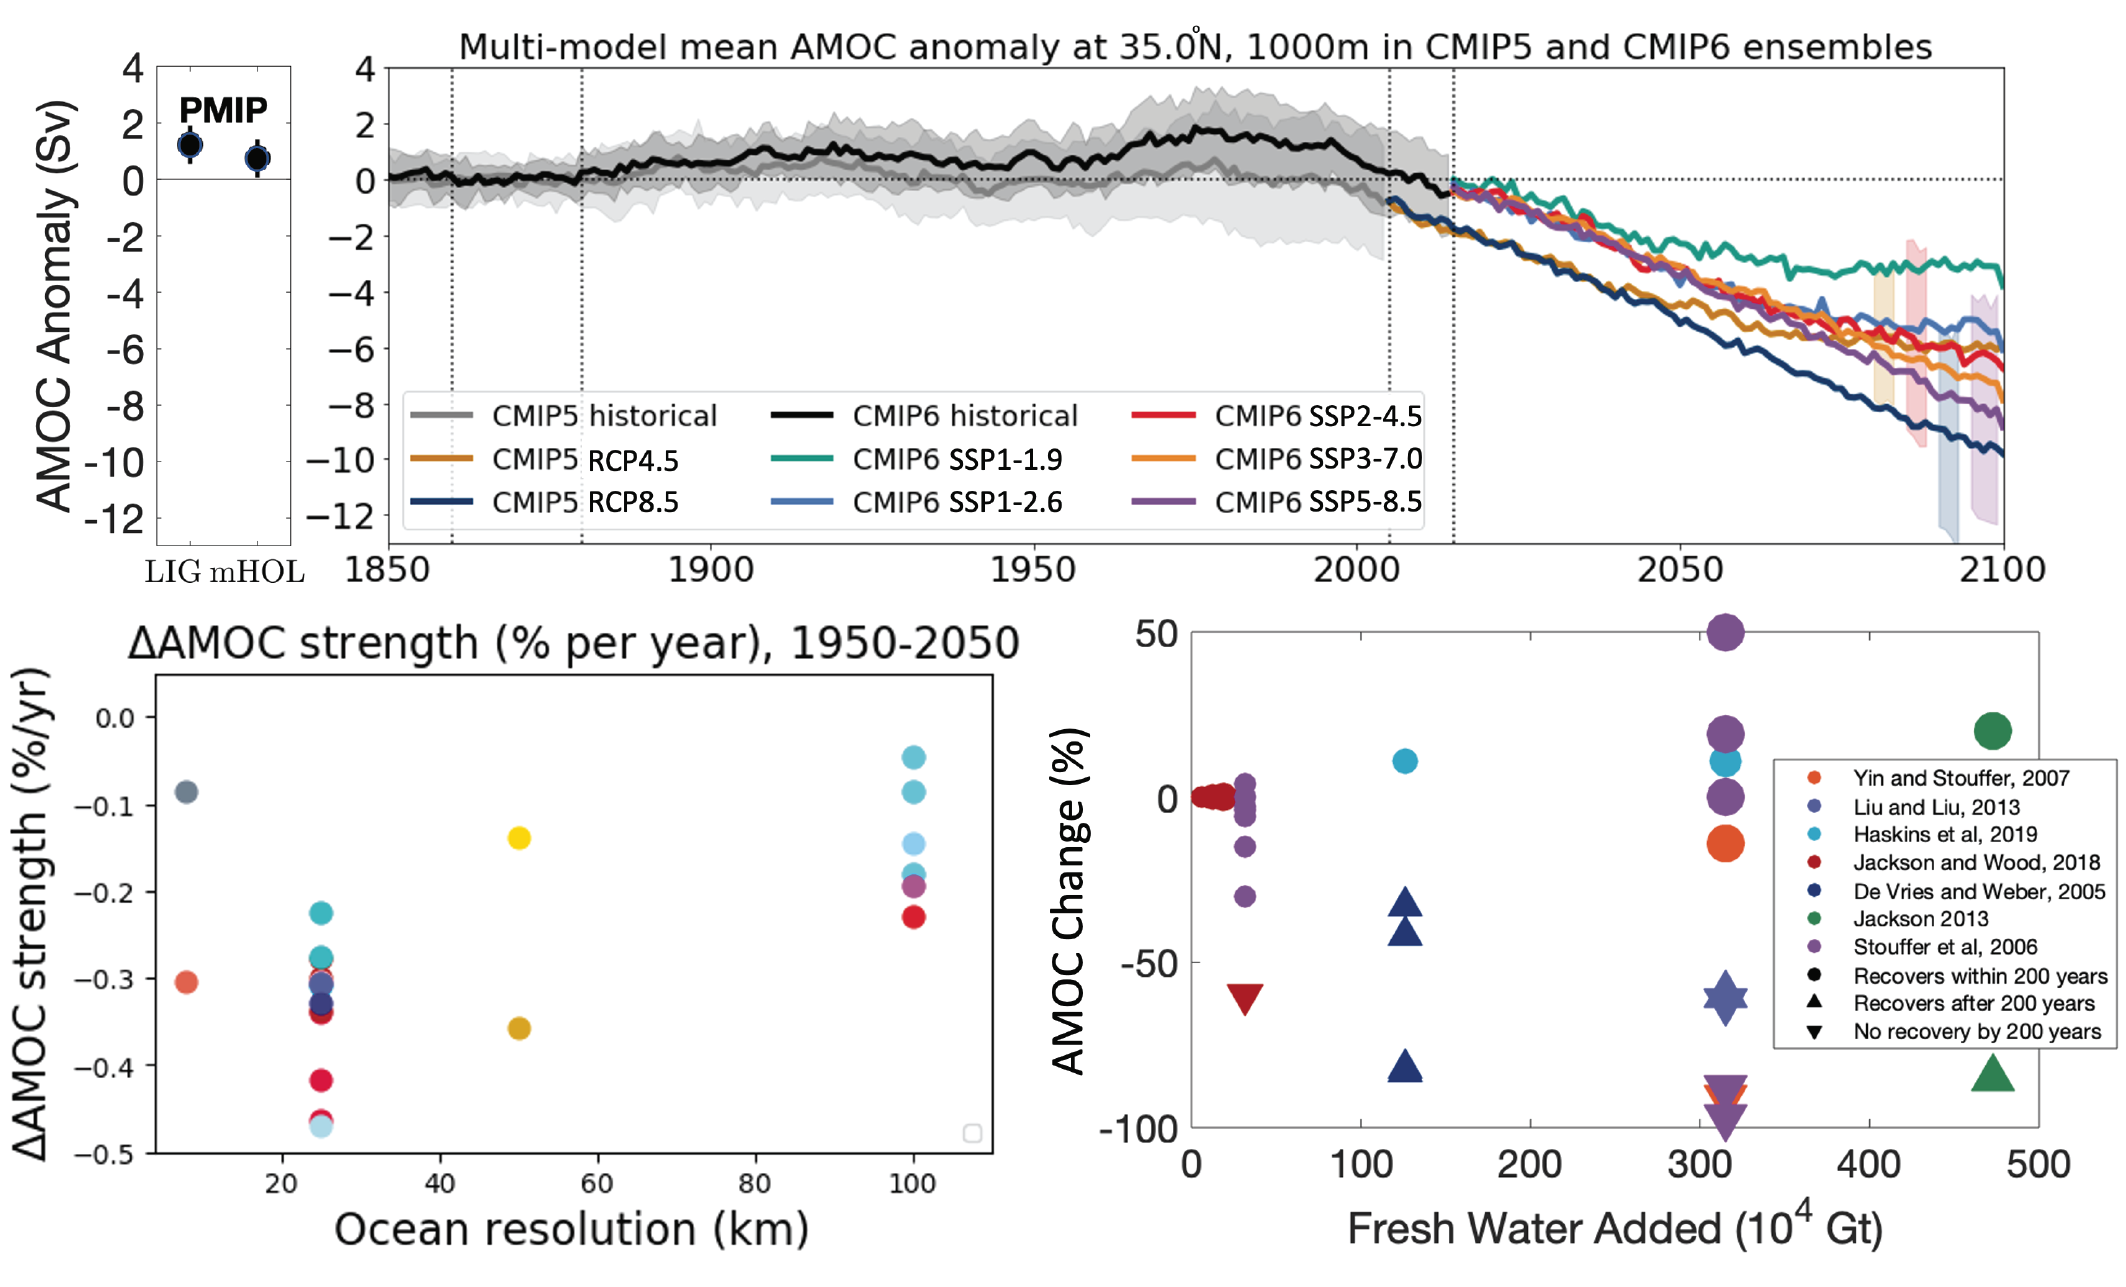
Figure caption
Figure 9.10 | Atlantic Meridional Overturning Circulation (AMOC) strength in simulations and sensitivity to resolution and forcing. (Top left) AMOC magnitude (units: Sverdrup (Sv) = 109kgs–1) in Paleoclimate Modelling Intercomparison Project (PMIP) experiments. (Top right) Time series of AMOC from Coupled Model Intercomparison Project Phase 5 and 6 (CMIP5 and CMIP6) based on (Menary et al., 2020b). (Bottom left) Percent change in AMOC strength per year at different resolutions over the 1950–2050 period with colours for model families (Roberts et al., 2020). (Bottom right) A compilation of percentage changes in the simulated AMOC after applying an additional freshwater flux in the subpolar North Atlantic at the surface for a limited time (de Vries and Weber, 2005; Stouffer et al., 2006; Yin and Stouffer, 2007; Jackson, 2013; Liu and Liu, 2013; Jackson and Wood, 2018; Haskins et al., 2019). Symbols indicate whether the AMOC recovers within 200 years (circles), is starting to recover (upwards arrow), or does not recover within 200 years (downwards arrow). Symbol size indicates rate of freshwater input. Further details on data sources and processing are available in the chapter data table (Table 9.SM.9).