Back chapter figures
Figure 9.11
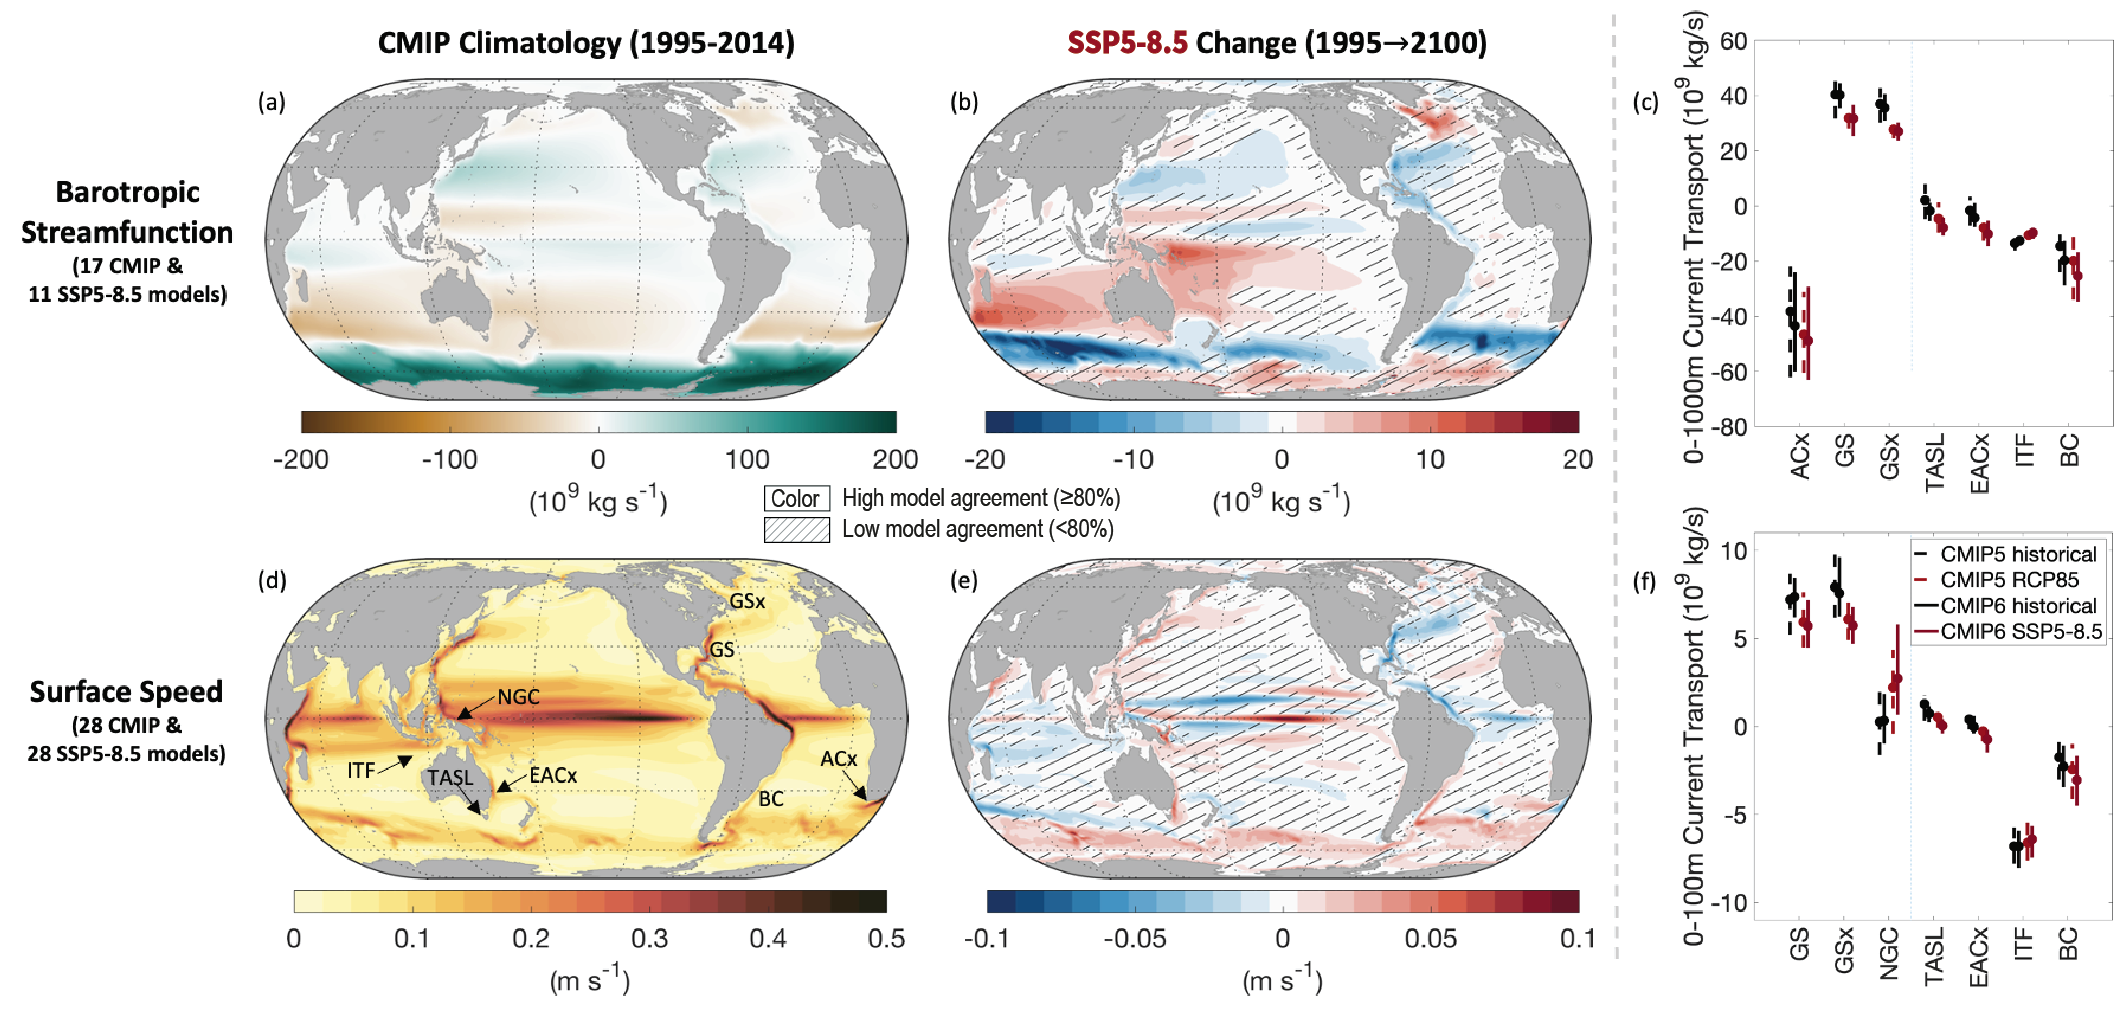
Figure caption
Figure 9.11 | Simulated barotropic streamfunction, surface speed and major current transport in Coupled Model Intercomparison Project Phase 5 and 6 (CMIP5 and CMIP6). (a) Mean barotropic streamfunction (unit: 109kgs–1; 1995–2014) and projected barotropic streamfunction change (109kgs–1; 2018–2100 vs 1995–2014) under (b) SSP5-8.5. (d) Mean surface (0–100 m) speed (m s–1) and projected surface speed change (m s–1, 2081–2100) versus 1995–2014 under (e) SSP5-8.5. (c, f) Median and likely range of 1995–2014 and 2081–2100 transport of three currents with the largest transport change and four with the largest fractional change (Sen Gupta et al., 2016). (c) Deep currents: Agulhas Extension (ACx), Gulf Stream (GS), Gulf Stream Extension (GSx), Tasman Leakage (TASL), East Australia Current Extension (EACx), Indonesian Throughflow (ITF), and Brazil Current (BC). (f) Shallow currents: as for deep but with New Guinea Current (NGC), and without ACx. No overlay indicates regions with high model agreement, where ≥80% of models agree on the sign of change. Diagonal lines indicate regions with low model agreement, where <80% of models agree on the sign of change (see Cross-Chapter Box Atlas.1 for more information). Further details on data sources and processing are available in the chapter data table (Table 9.SM.9).