Back chapter figures
Figure 9.12
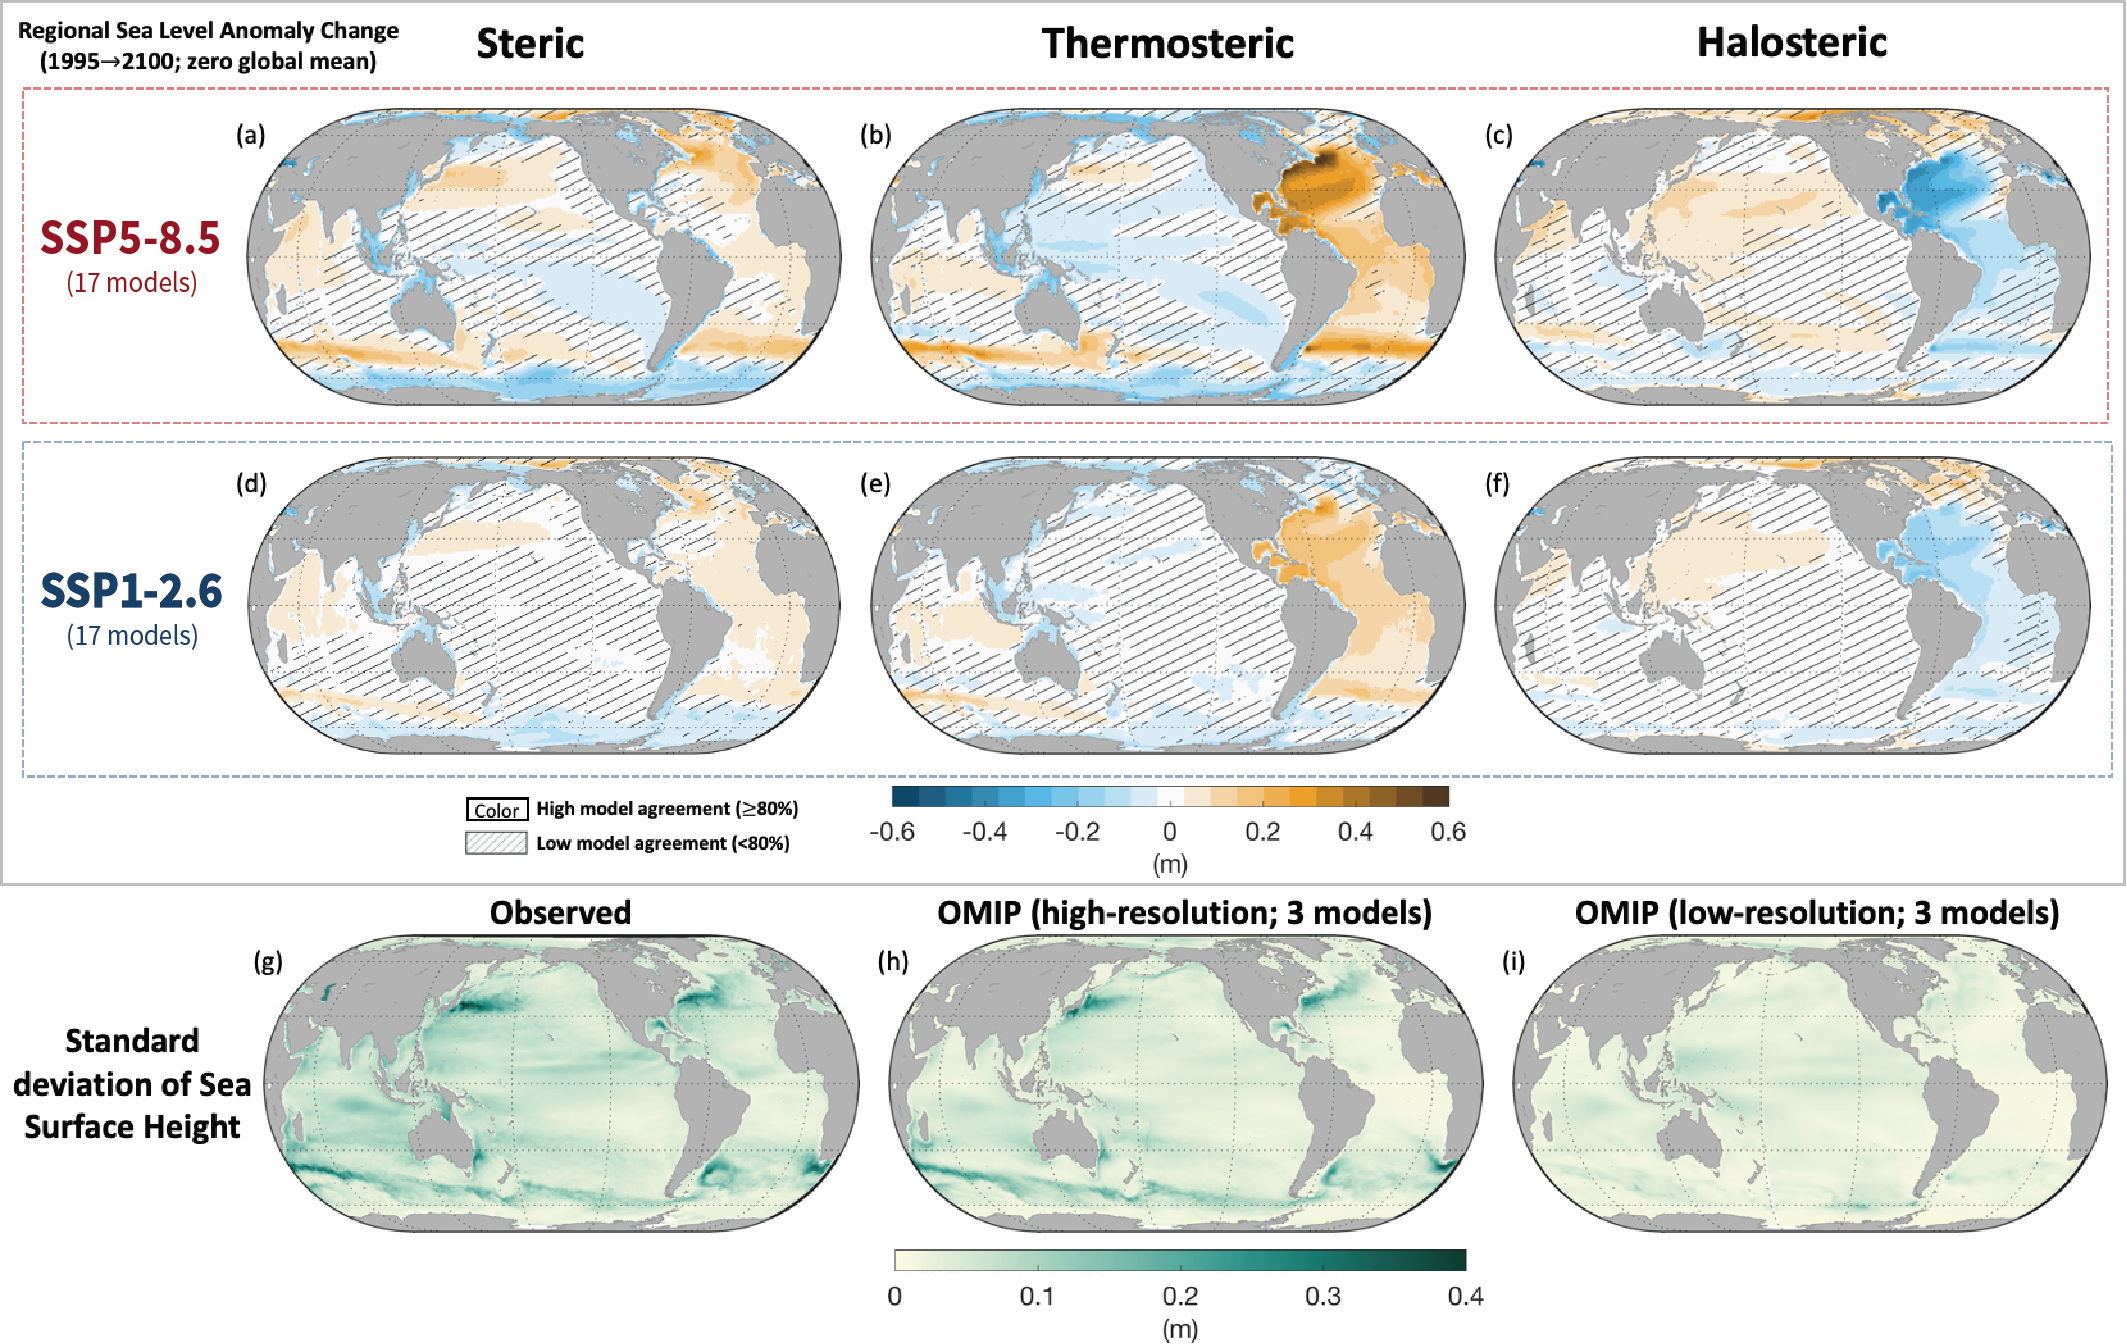
Figure caption
Figure 9.12 | (a–f) Coupled Model Intercomparison Project Phase 6 (CMIP6) multi-model mean projected change contributions to relative sea level change in (a, d) steric sea level anomaly, (b, e) thermosteric sea level anomaly, and (c, f) halosteric sea level anomaly between 1995–2014 and 2081–2100 using a method that does not require a reference level (Landerer et al., 2007). Global mean change has been removed from these figures, consistent with the methods in Sections 9.6.3 and 9.SM.4 and the definitions of Gregory et al. (2019). (Gregory et al., 2019). See Figure 9.27 for global mean sea level (GMSL). (g–i) Standard deviation of ocean dynamic sea level change from (g) Aviso observations (10-day high-pass filter); (h) five-day mean of high-resolution Ocean Model Intercomparison Project phase 2 (OMIP-2) models forced with observed fluxes; and (i) five-day mean of low-resolution OMIP-2 models which are comparable in resolution to the models in (a–f). No overlay indicates regions with high model agreement, where ≥80% of models agree on the sign of change. Diagonal lines indicate regions with low model agreement, where <80% of models agree on the sign of change (see Cross-Chapter Box Atlas.1 for more information). Further details on data sources and processing are available in the chapter data table (Table 9.SM.9).