Back chapter figures
Figure 9.15
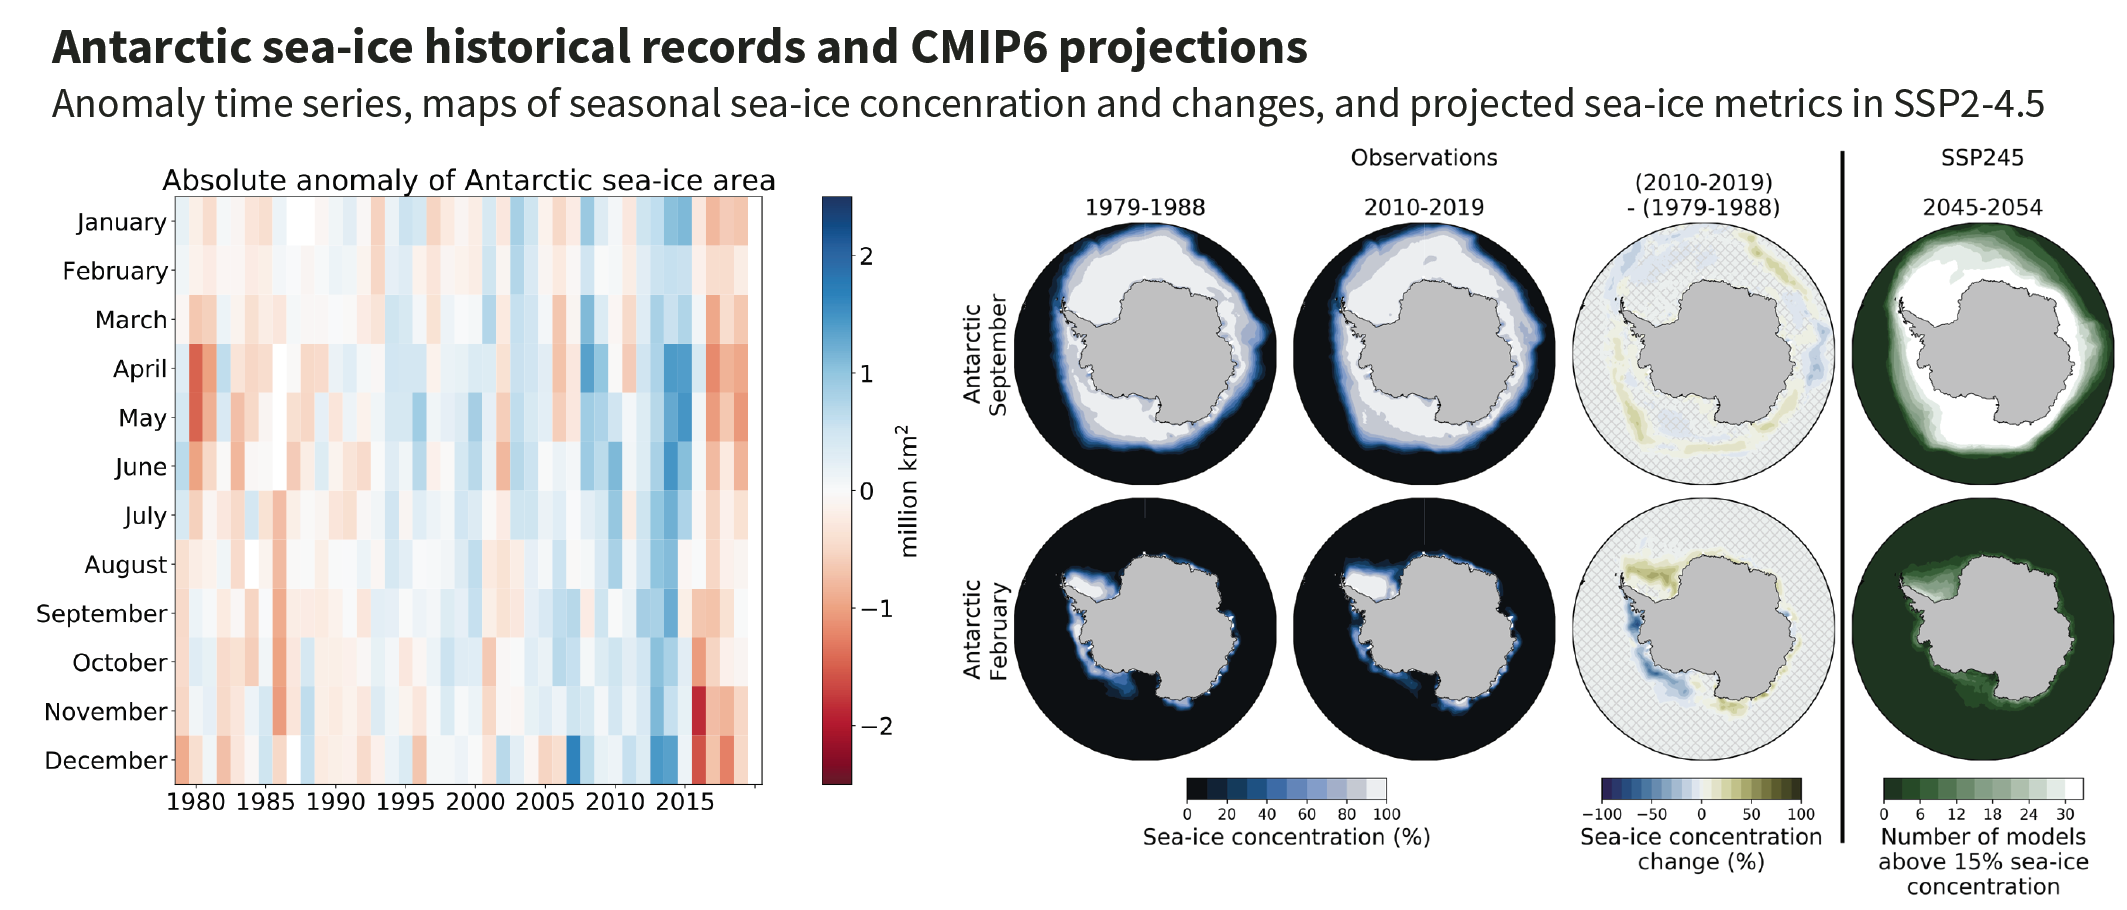
Figure caption
Figure 9.15 | Antarctic sea ice historical records and Coupled Model Intercomparison Project Phase 6 (CMIP6) projections. (left) Absolute anomaly of observed monthly mean Antarctic sea ice area during the period 1979–2019 relative to the average monthly mean Antarctic sea ice area during the period 1979–2008. (right) Sea ice coverage in the Antarctic as given by the average of the three most widely used satellite-based estimates for September and February, which usually are the months of maximum and minimum sea ice coverage, respectively. First column: Mean sea ice coverage during the decade 1979–1988. Second column: Mean sea ice coverage during the decade 2010–2019. Third column: Absolute change in sea ice concentration between these two decades, with grid lines indicating non-significant differences. Fourth column: Number of available CMIP6 models that simulate a mean sea ice concentration above 15% for the decade 2045–2054. The average observational record of sea ice area is derived from the UHH sea ice area product (Doerr et al., 2021), based on the average sea ice concentration of OSISAF/CCI (OSI-450 for 1979–2015, OSI-430b for 2016–2019) (Lavergne et al., 2019), NASA Team (version 1, 1979–2019) (Cavalieri et al., 1996) and Bootstrap (version 3, 1979–2019) (Comiso, 2017) that is also used for the figure panels showing observed sea ice concentration. Further details on data sources and processing are available in the chapter data table (Table 9.SM.9).