Back chapter figures
Figure 9.16
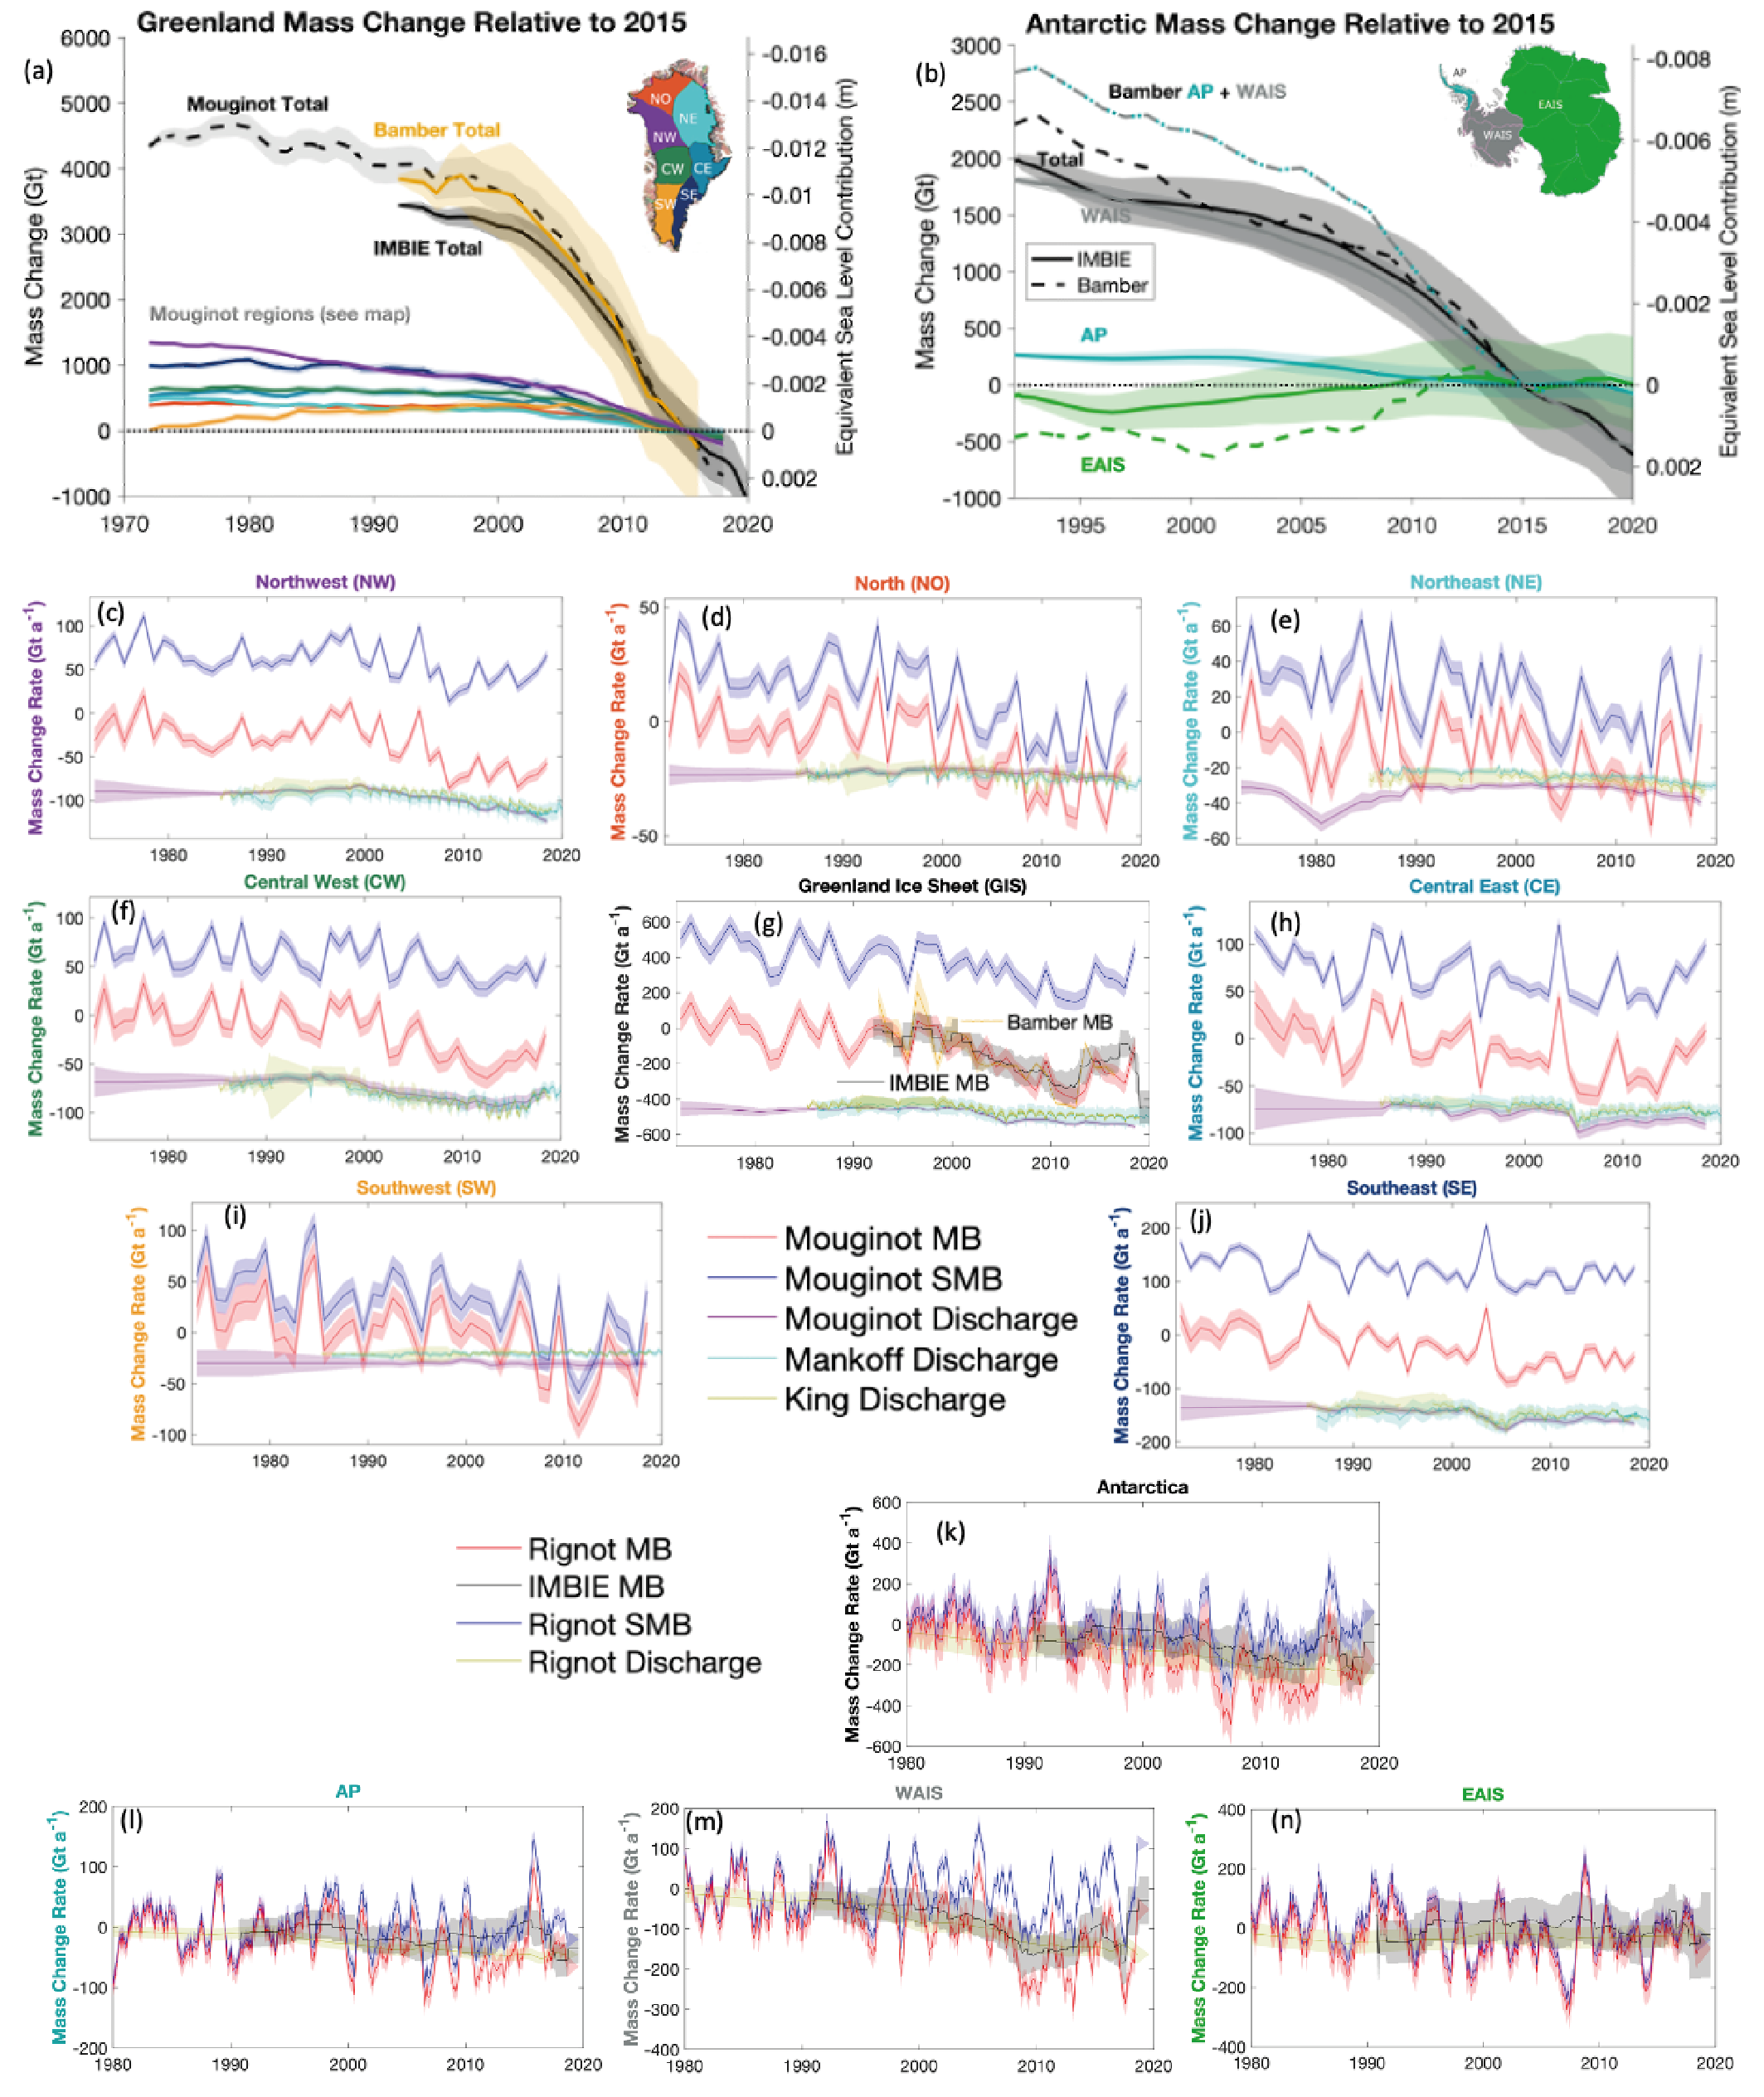
Figure caption
Figure 9.16 | Mass changes and mass change rates for Greenland and Antarctic ice sheet regions. (a) Time series of mass changes in Greenland for each of the major drainage basins shown in the inset figure (Bamber et al., 2018b; Mouginot et al., 2019; The IMBIE Team, 2021) for the periods 1972–2016, 1992–2018, and 1992–2020. (b) Time series of mass changes for three portions of Antarctica (Bamber et al., 2018b; The IMBIE Team, 2021) for the period 1992–2016 and 1992–2020. Estimates of mass change rates of surface mass balance, discharge and mass balance in (g) all of Greenland and (c–f, h–j) in seven Greenland regions (Bamber et al., 2018b; Mankoff et al., 2019; Mouginot et al., 2019; King et al., 2020). Estimates of mass change rates of surface mass balance, discharge and mass balance for (k) all of Antarctica and (l–n) for three regions of Antarctica (Bamber et al., 2018b; The IMBIE Team, 2018; Rignot et al., 2019). Further details on data sources and processing are available in the chapter data table (Table 9.SM.9).