Back chapter figures
Figure 9.17
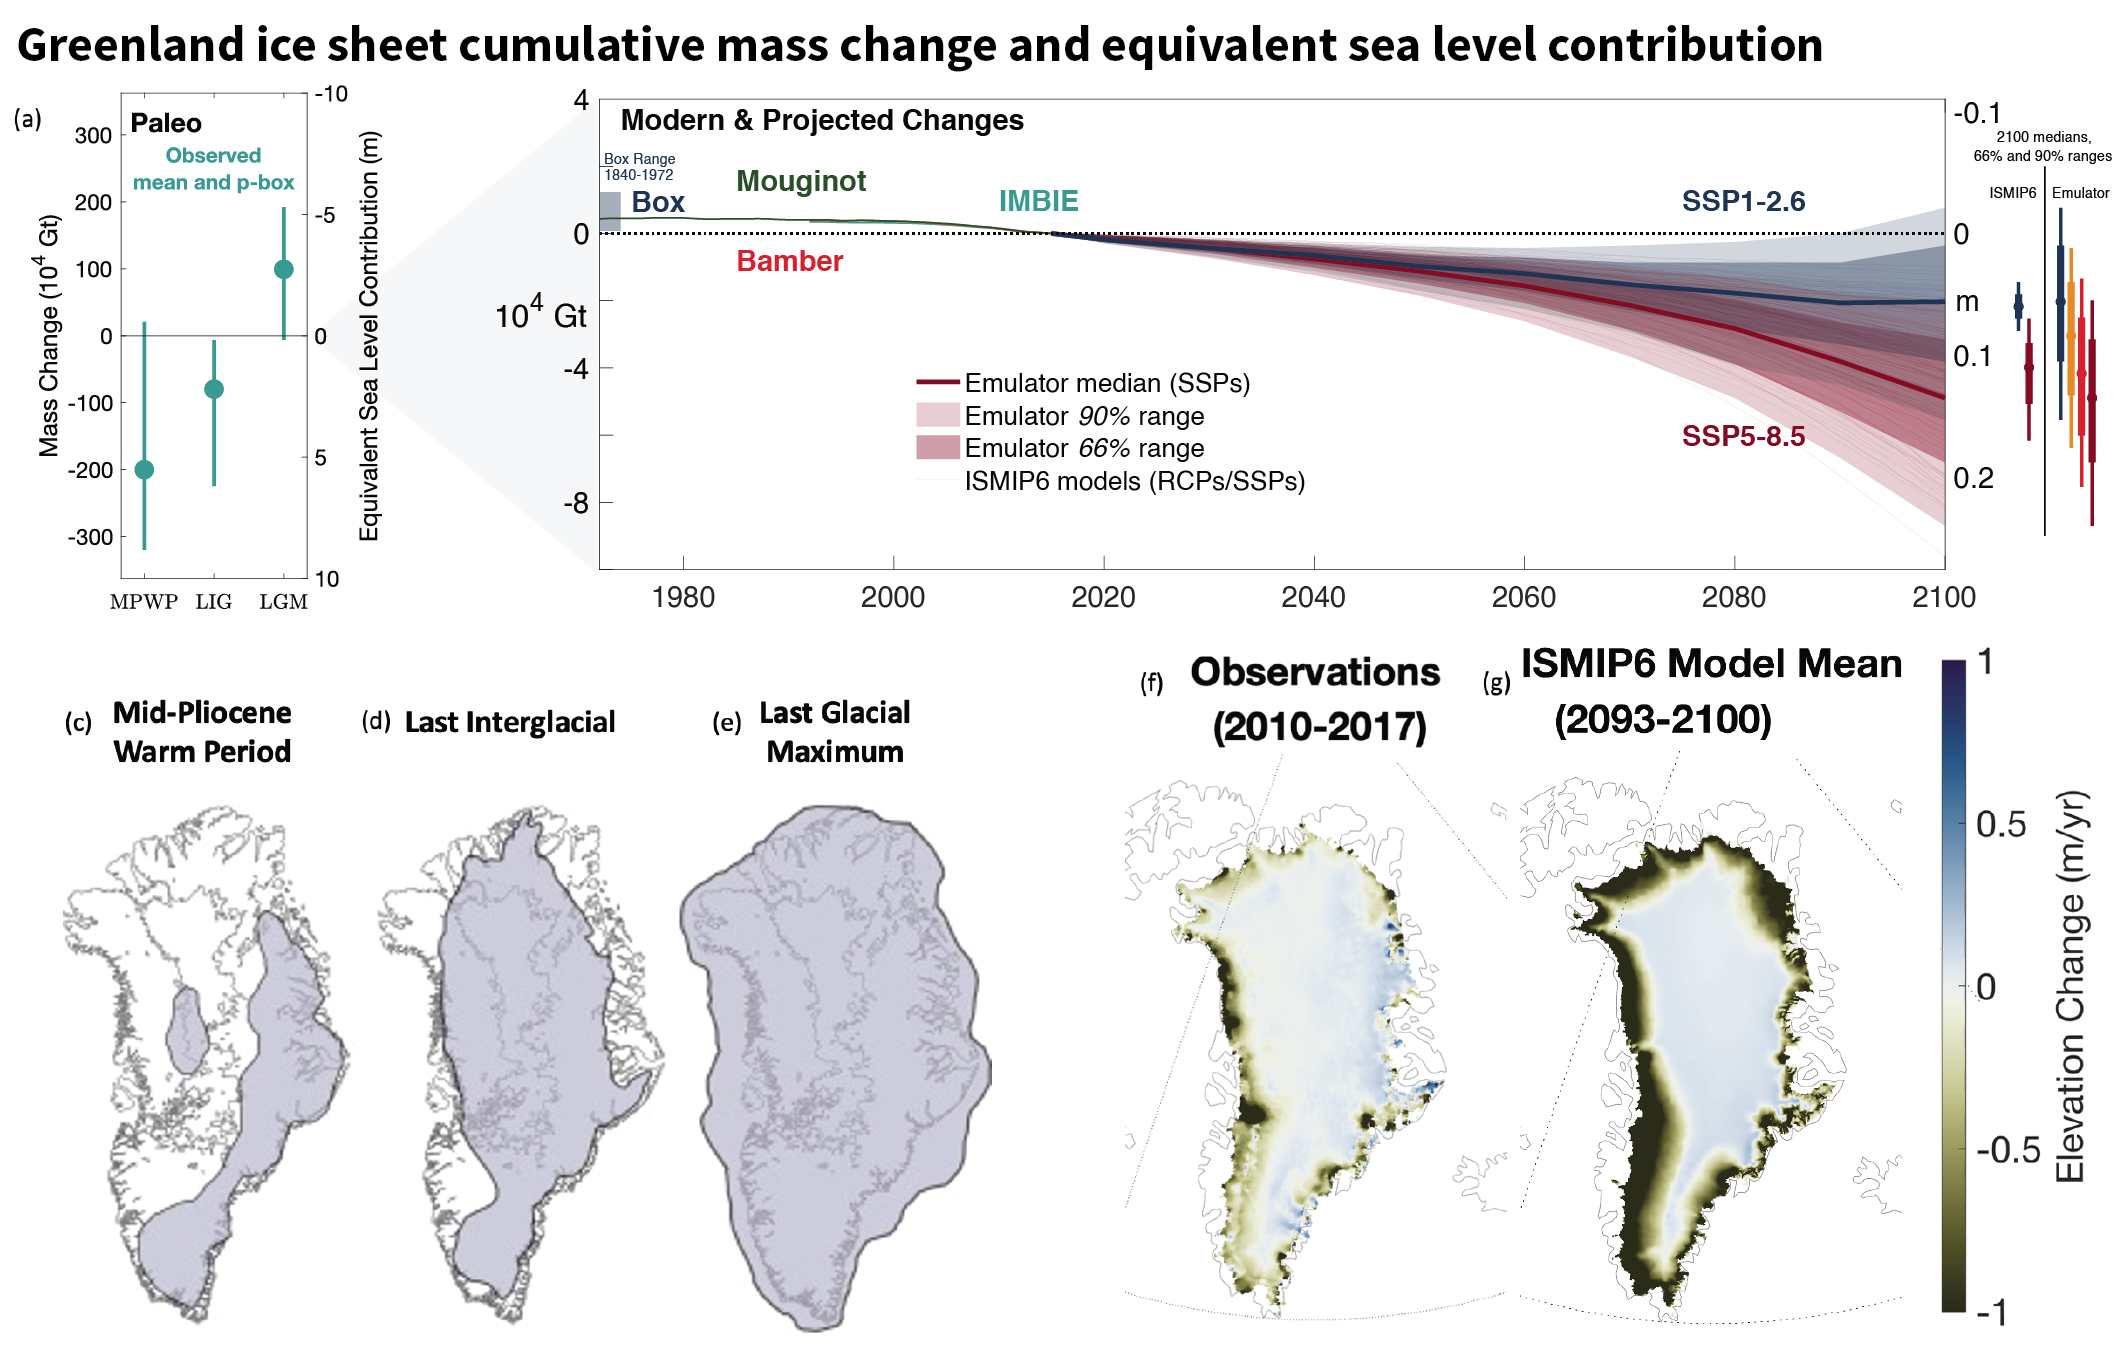
Figure caption
Figure 9.17 | Greenland Ice Sheet cumulative mass change and equivalent sea level contribution. (a) A p-box Section 9.6.3.2) based estimate of the range of values of paleo Greenland Ice Sheet mass and sea level equivalents relative to present day and the median over all central estimates (Simpson et al., 2009; Argus and Peltier, 2010; Colville et al., 2011; Dolan et al., 2011; Fyke et al., 2011; Robinson et al., 2011; Born and Nisancioglu, 2012; K.G. Miller et al., 2012; Dahl-Jensen et al., 2013; Helsen et al., 2013; Nick et al., 2013; Quiquet et al., 2013; Stone et al., 2013; Colleoni et al., 2014; Lecavalier et al., 2014; Robinson and Goelzer, 2014; Calov et al., 2015, 2018; Dutton et al., 2015; Koenig et al., 2015; Peltier et al., 2015; Stuhne and Peltier, 2015; Vizcaino et al., 2015; Goelzer et al., 2016; Khan et al., 2016; Yau et al., 2016; de Boer et al., 2017; Simms et al., 2019); (b, left) cumulative mass loss (and sea level equivalent) since 2015 from 1972 (Mouginot et al., 2019) and 1992 (Bamber et al., 2018b; The IMBIE Team, 2020), the estimated mass loss from 1840 (Box and Colgan, 2013; Kjeldsen et al., 2015) indicated with a shaded box, and projections from Ice Sheet Model Intercomparison Project for CMIP6 (ISMIP6) to 2100 under RCP8.5/SSP5-8.5 and RCP2.6/SSP1-2.6 scenarios (thin lines from Goelzer et al. (2020); Edwards et al. (2021); Payne et al. (2021)) and ISMIP6 emulator under SSP5-8.5 and SSP1-2.6 to 2100 (shades and bold line; Edwards et al., 2021); (b, right) 17th–83rd and 5th–95th percentile ranges for ISMIP6 and ISMIP6 emulator at 2100. Schematic interpretations of individual reconstructions (Lecavalier et al., 2014; Goelzer et al., 2016; Berends et al., 2019) of the spatial extent of the Greenland Ice Sheet are shown for the: (c) mid-Pliocene Warm Period; (d) the Last Interglacial; and (e) the Last Glacial Maximum: grey shading shows extent of grounded ice. Maps of mean elevation changes (f) 2010–2017 derived from CryoSat 2 radar altimetry (Bamber et al., 2018b) and (g) ISMIP6 model mean (2093–2100) projected changes for the MIROC5 climate model under the RCP8.5 scenario (Goelzer et al., 2020). Further details on data sources and processing are available in the chapter data table (Table 9.SM.9).