Back chapter figures
Figure 9.18
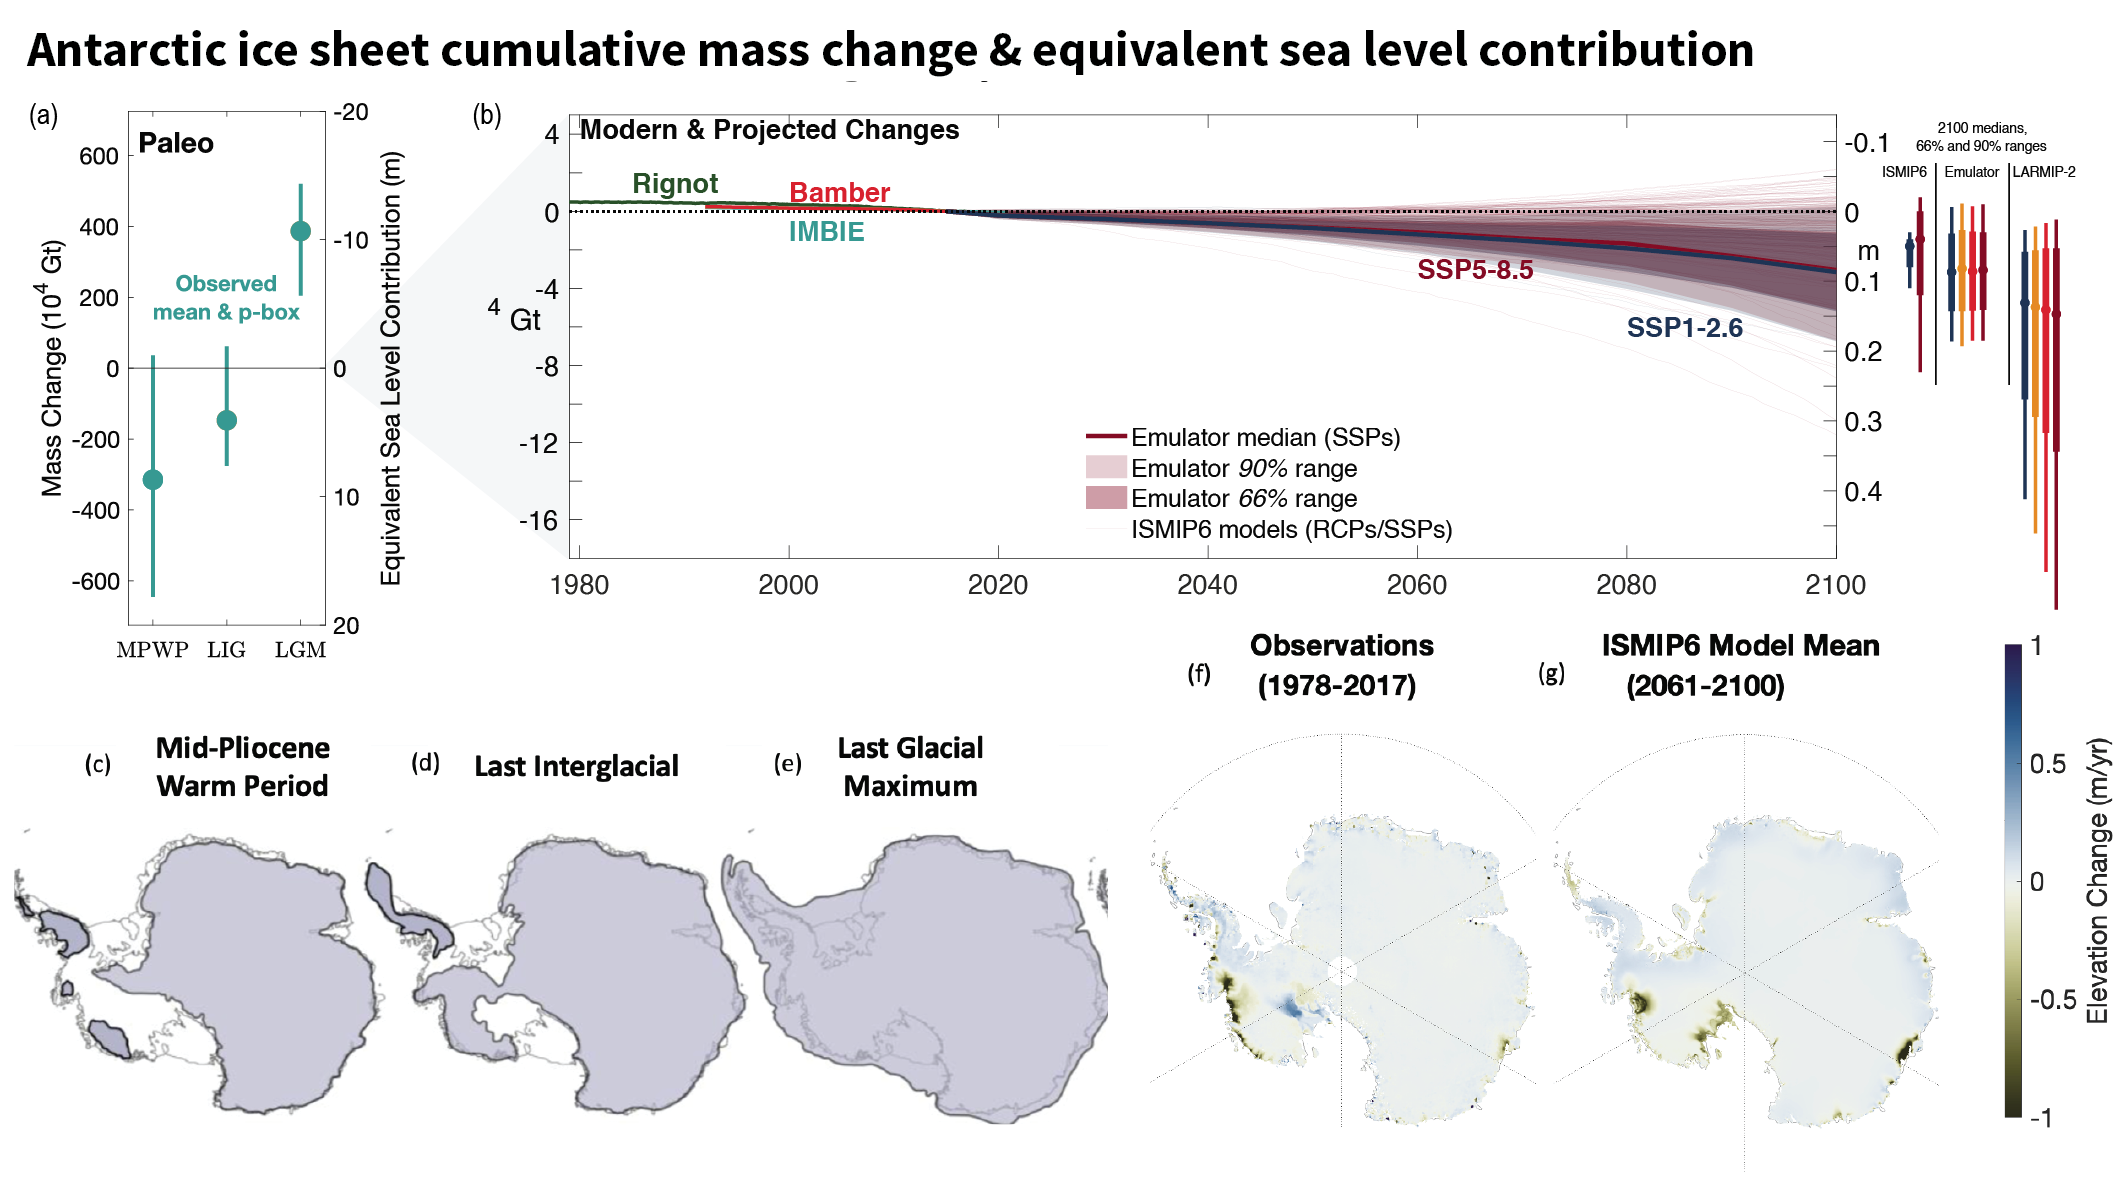
Figure caption
Figure 9.18 | Antarctic Ice Sheet cumulative mass change and equivalent sea level contribution. (a) A p-box Section 9.6.3.2) based estimate of the range of values of paleo Antarctic ice sheet mass and sea level equivalents relative to present day and the median over all central estimates (Bamber et al., 2009; Argus and Peltier, 2010; Dolan et al., 2011; Mackintosh et al., 2011; Golledge et al., 2012, 2013, 2014, 2015, 2017b; K.G. Miller et al., 2012; Whitehouse et al., 2012; Ivins et al., 2013; Argus et al., 2014; Briggs et al., 2014; Maris et al., 2014; de Boer et al., 2015, 2017; Dutton et al., 2015; Pollard et al., 2015; DeConto and Pollard, 2016; Gasson et al., 2016; Goelzer et al., 2016; Yan et al., 2016; Kopp et al., 2017; Simms et al., 2019); (b left) cumulative mass loss (and sea level equivalent) since 2015, with satellite observations shown from 1993 (Bamber et al., 2018a; The IMBIE Team, 2018; WCRP Global Sea Level Budget Group, 2018) and observations from 1979 (Rignot et al., 2019), and projections from Ice Sheet Model Intercomparison Project for CMIP6 (ISMIP6) to 2100 under RCP8.5/SSP5-8.5 and RCP2.6/SSP1-2.6 scenarios (thin lines from Seroussi et al., 2020; Edwards et al., 2021; Payne et al., 2021)and ISMIP6 emulator under SSP5-8.5 and SSP1-2.6 to 2100 (shades and bold line; Edwards et al., 2021); (b, right) 17th–83rd, 5th–95th percentile ranges for ISMIP6, ISMIP6 emulator, and LARMIP-2 including surface mass balance (SMB) at 2100. (c–e) Schematic interpretations of individual reconstructions (Anderson et al., 2002; Bentley et al., 2014; de Boer et al., 2015; Goelzer et al., 2016) of the spatial extent of the Antarctic Ice Sheet are shown for the: (c) mid-Pliocene Warm Period, (d) Last Interglacial; and (e) Last Glacial Maximum (Fretwell et al., 2013): grey shading shows extent of grounded ice. (f –g) Maps of mean elevation changes (f) 1978–2017 derived from multi-mission satellite altimetry (Schröder et al., 2019) and (g) ISMIP6: 2061–2100 projected changes for an ensemble using the Norwegian Climate Center’s Earth System Model (NorESM1-M) climate model under the RCP8.5 scenario (Seroussi et al., 2020). Further details on data sources and processing are available in the chapter data table (Table 9.SM.9).