Back chapter figures
Figure 9.19
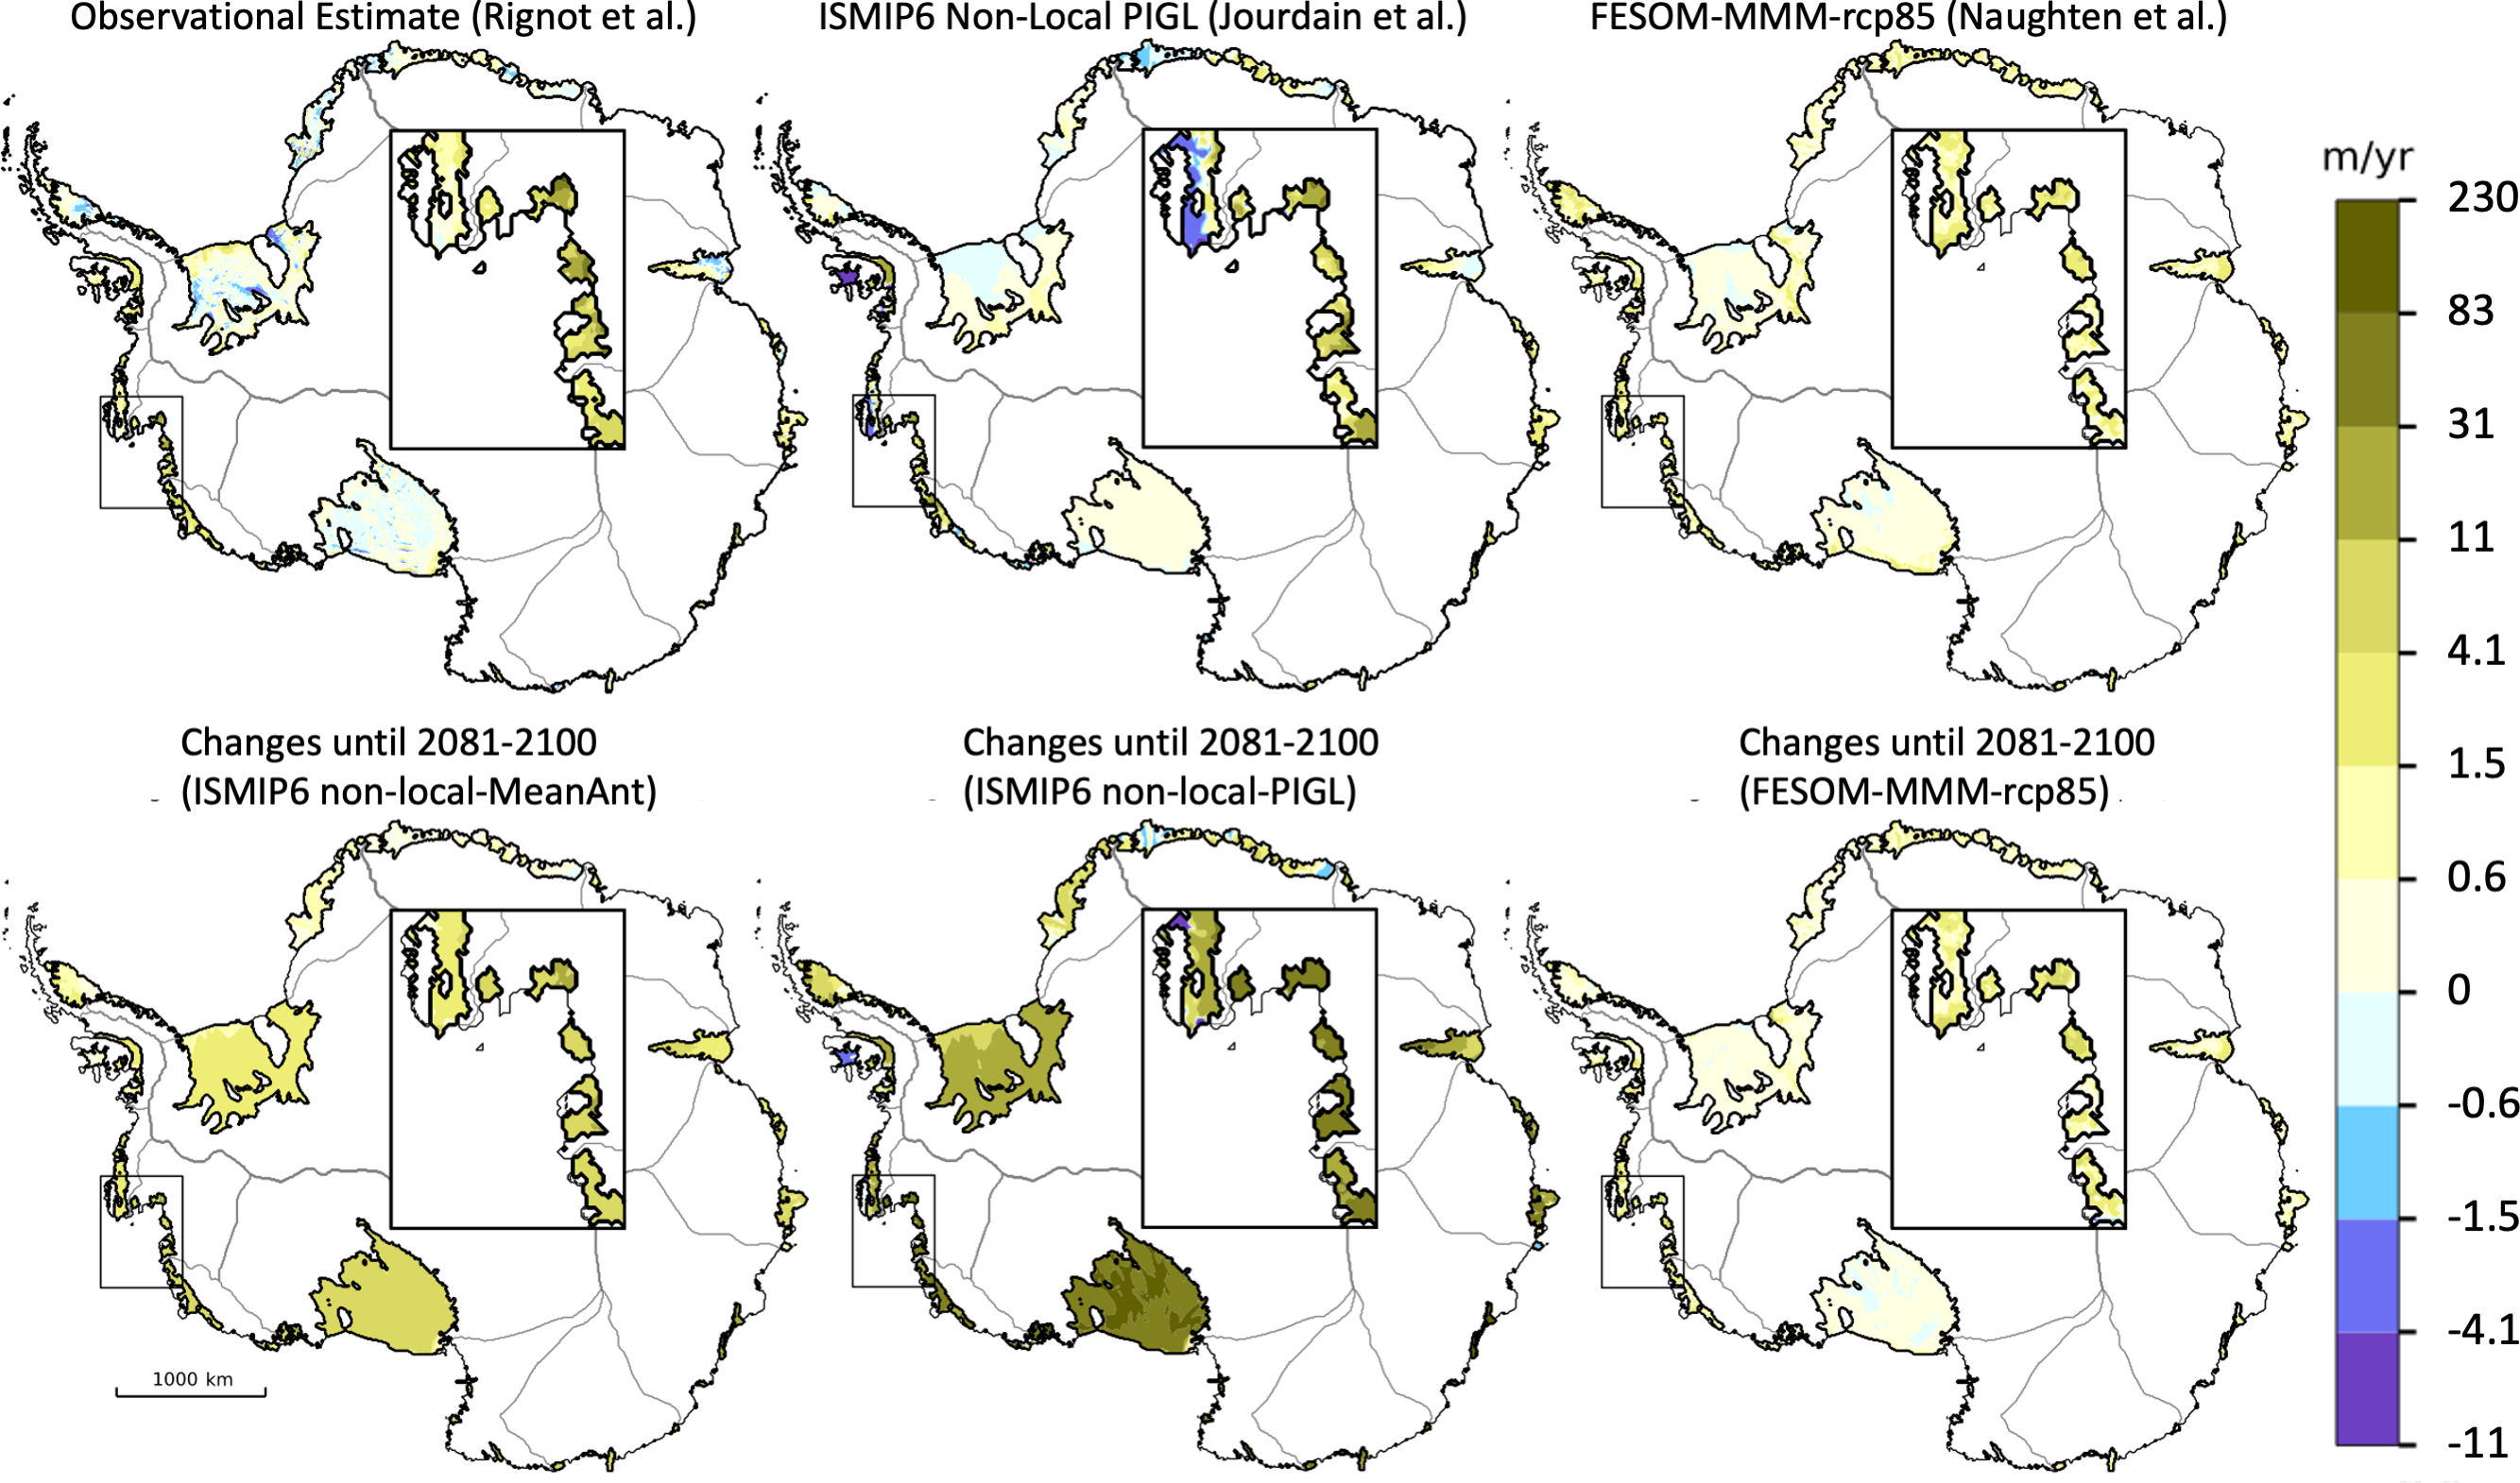
Figure caption
Figure 9.19 | Ice-shelf basal melt rates for present-day (upper panels) and changes from present-day to the end of the 21st century under the RCP8.5 scenario (lower panels). Present-day melt rates were estimated through: the input-output method constrained by satellite observations and atmosphere/snow simulations (Rignot et al., 2013) and representative of 2003–2008 (upper left); the Ice Sheet Model Intercomparison Project for CMIP6 (ISMIP6) non-local-PIGL parametrization constrained by observation-based ocean properties (Jourdain et al., 2020) and representative of 1995–2014 (upper centre); the Finite Element Sea ice/Ice Shelf Ocean Model (FESOM) simulation over 2006–2015, forced by atmospheric conditions from a Coupled Model Intercomparison Project Phase 5 (CMIP5) multi-model mean (MMM) under the RCP8.5 scenario (Naughten et al., 2018) (upper right). Future anomalies are calculated as 2081–2100 minus present-day using the ISMIP6 non-local-MeanAnt and non-local-PIGL parametrizations (Jourdain et al., 2020) (lower left and centre, respectively) based on projections from the Norwegian Climate Center’s Earth System Model (NorESM1-M) CMIP5 model, and the FESOM-MMM projection (lower right). Note the symmetric-log colour bar (linear around zero, logarithmic for stronger negative and positive values). Inset highlights the Amundsen Sea Region. Further details on data sources and processing are available in the chapter data table (Table 9.SM.9).