Back chapter figures
Figure 9.2
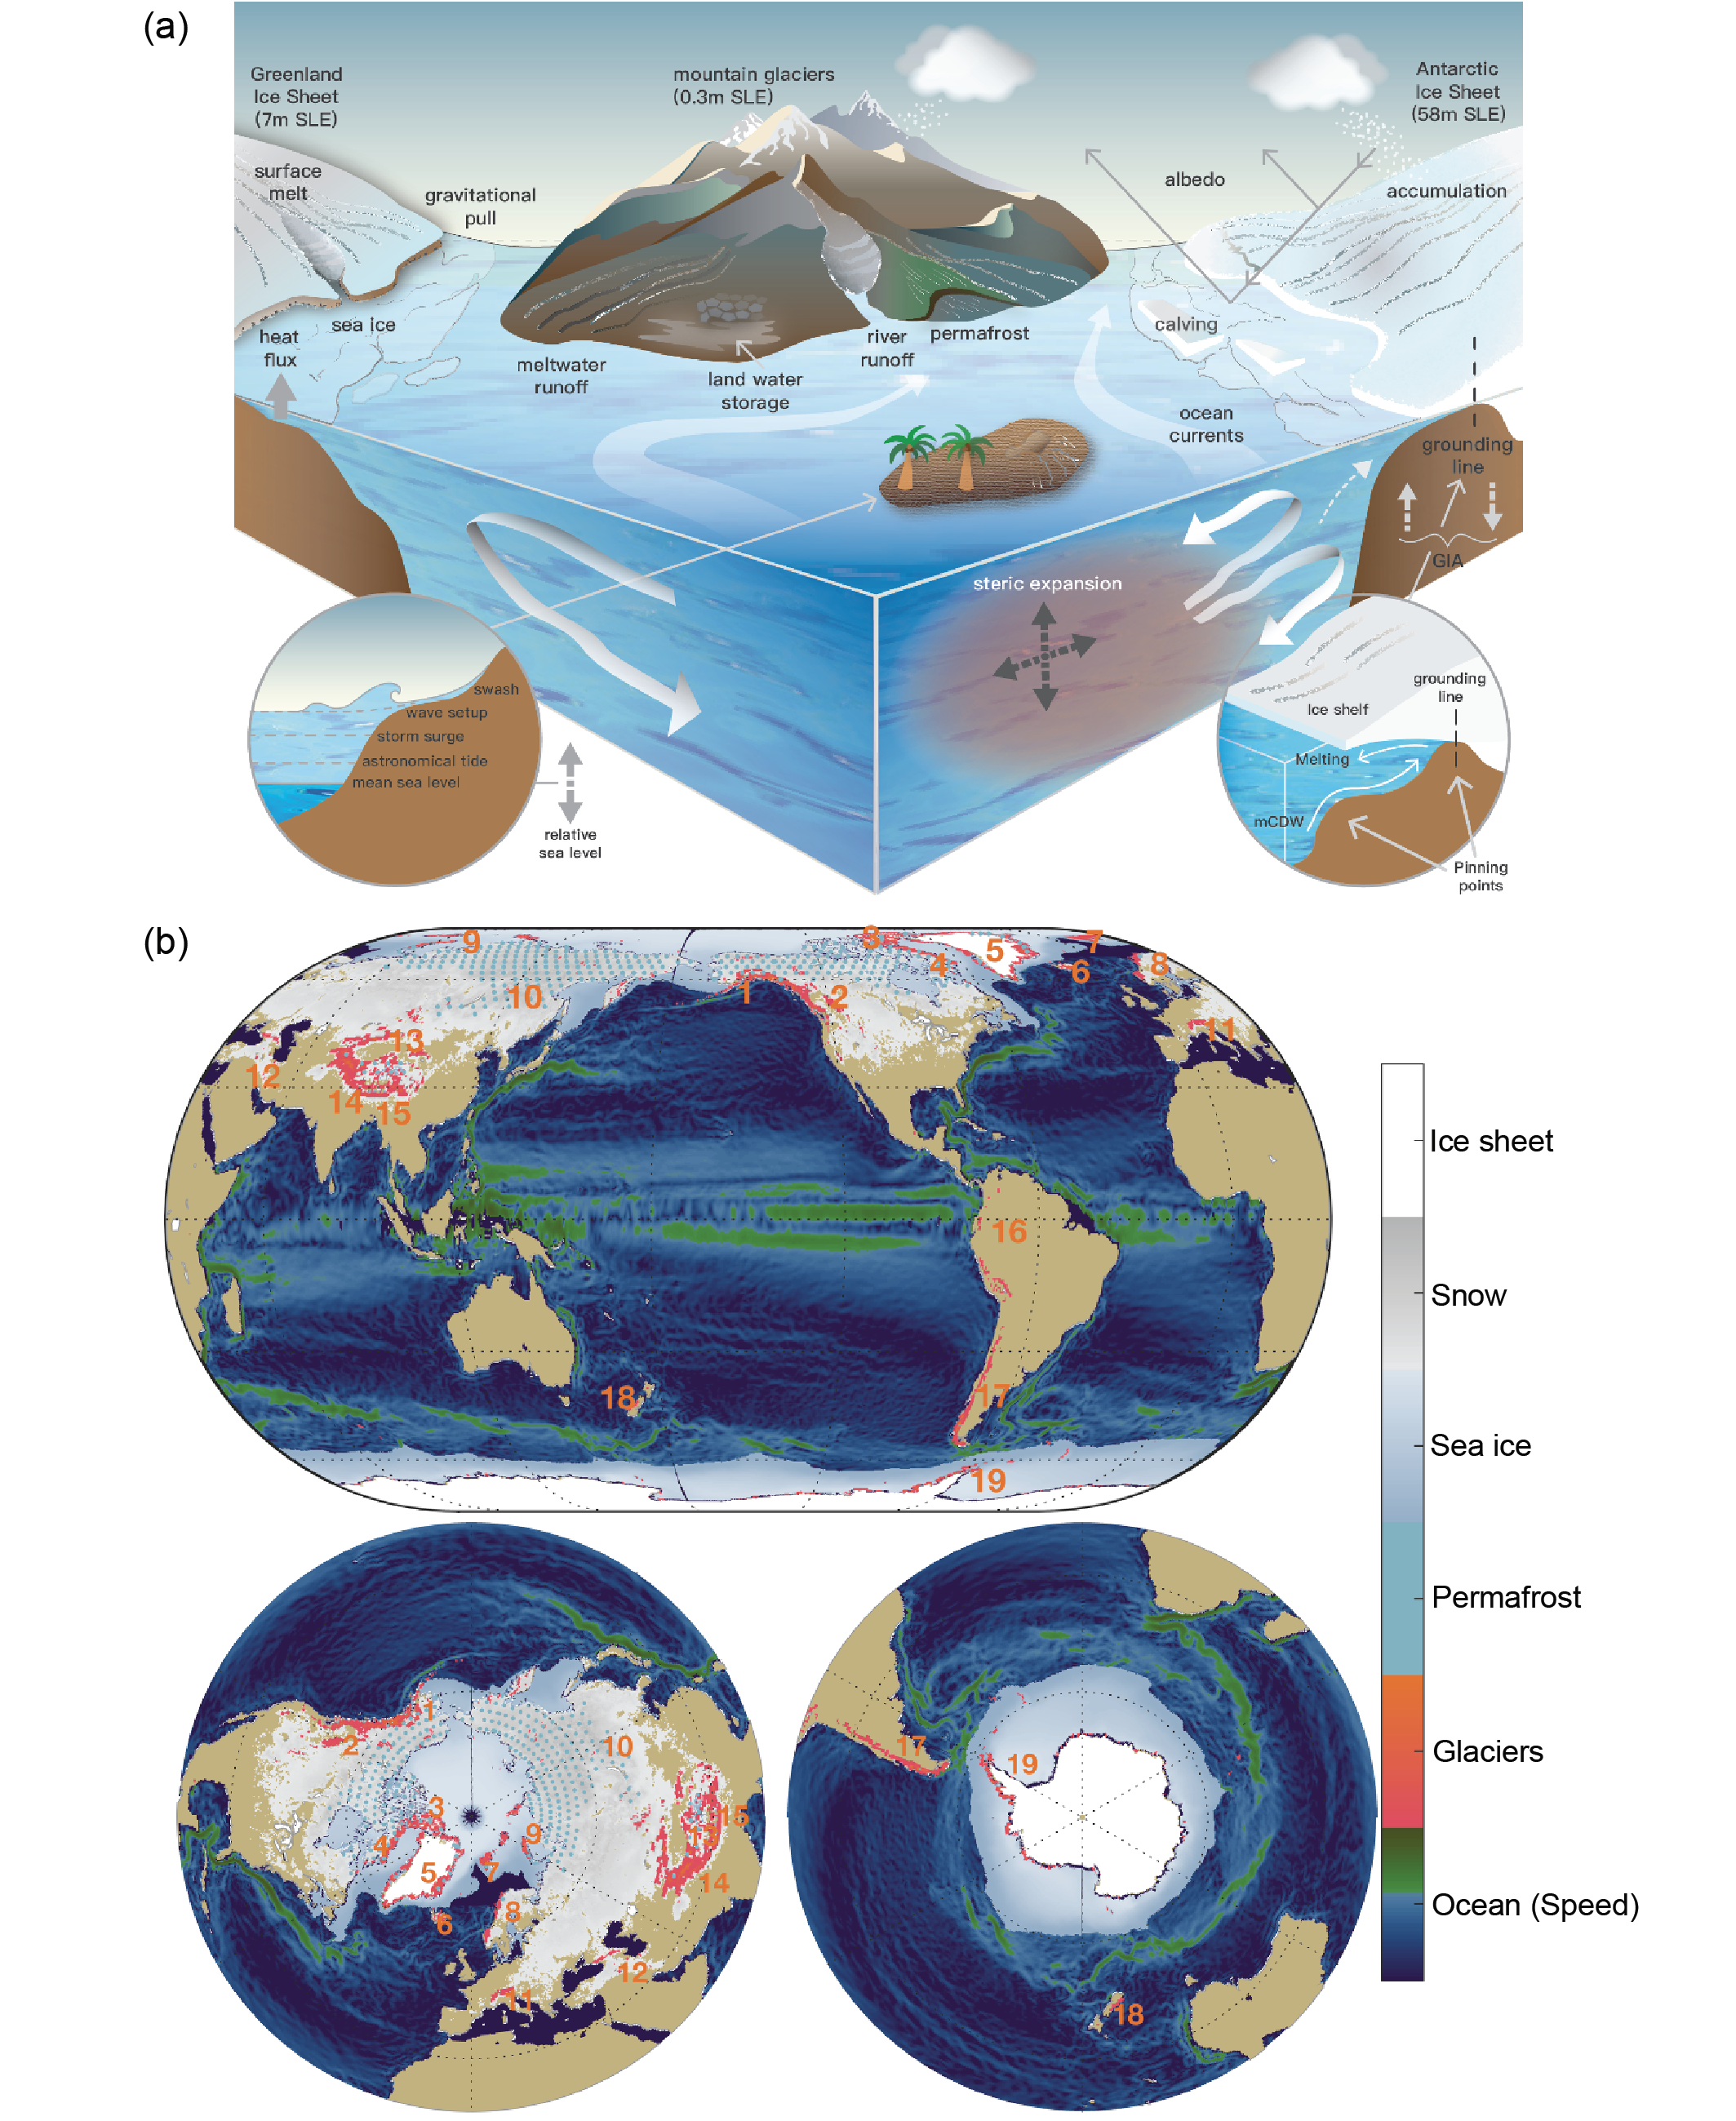
Figure caption
Figure 9.2 | Components of ocean, cryosphere and sea level assessed in this chapter. (a) Schematic of processes (mCDW=modified Circumpolar Deep Water, GIA=Glacial Isostatic Adjustment). White arrows indicate ocean circulation. Pinning points indicate where the grounding line is most stable and ice-sheet retreat will slow. (b) Geographic distribution of ocean and cryosphere components (numbers indicate glacierized regions (RGI Consortium, 2017)). See Figures 9.20 and 9.21 for labels. Sea ice shaded to indicate the annual mean concentration. Green ocean colours indicate larger surface current speed. Further details on data sources and processing are available in the chapter data table (Table 9.SM.9).