Back chapter figures
Figure 9.22
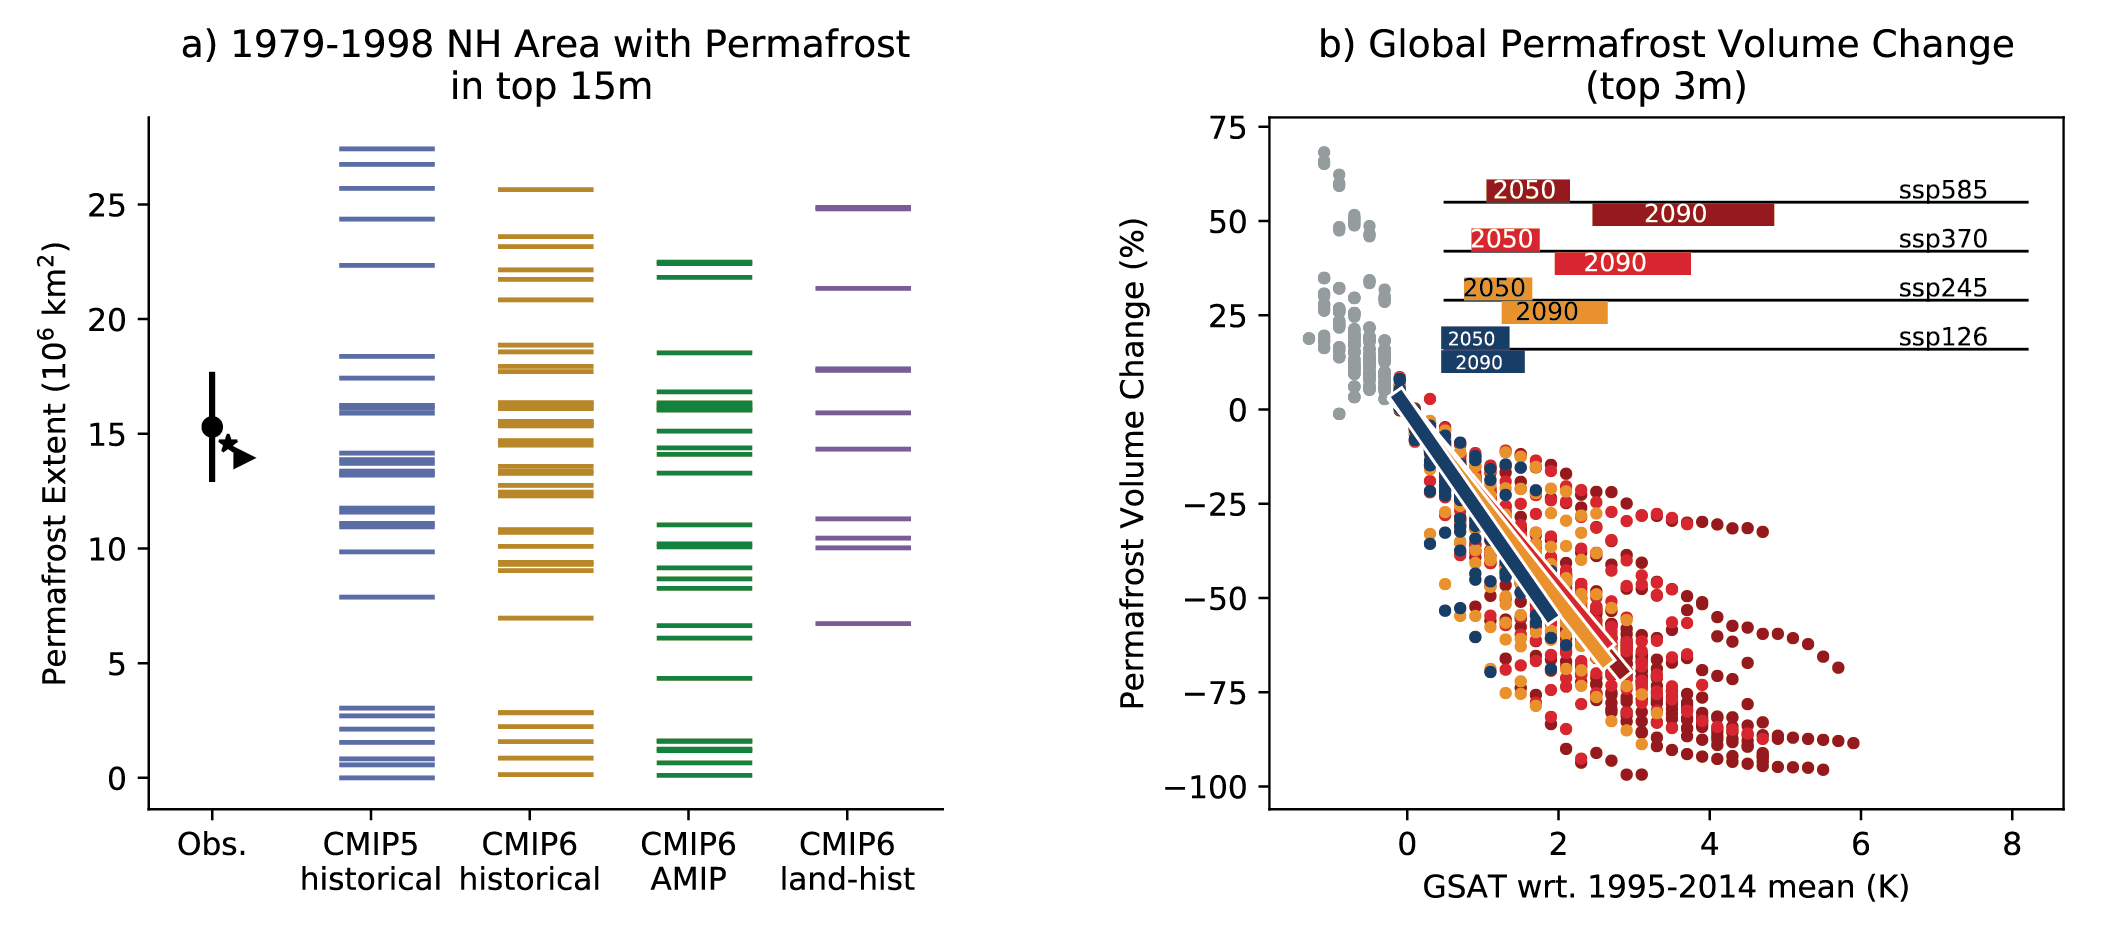
Figure caption
Figure 9.22 | Simulated versus observed permafrost extent and volume change by warming level. (a) Diagnosed Northern Hemisphere permafrost extent (area with perennially frozen ground at 15 m depth, or at the deepest model soil level if this is above 15 m) for 1979–1998, for available Coupled Model Intercomparison Project Phase 5 and 6 (CMIP5 and CMIP6) models, from the first ensemble member of the historical coupled run, and for CMIP6 Atmospheric Model Intercomparison Project (AMIP) (atmosphere+land surface, prescribed ocean) and land-hist (land only, prescribed atmospheric forcing) runs. Estimates of current permafrost extents based on physical evidence and reanalyses are indicated as black symbols – triangle: Obu et al. (2018); star: Zhang et al. (1999); circle: central value and associated range from Gruber (2012). (b) Simulated global permafrost volume change between the surface and 3 m depth as a function of the simulated global surface air temperature (GSAT) change, from the first ensemble members of a selection of scenarios, for available CMIP6 models. Further details on data sources and processing are available in the chapter data table (Table 9.SM.9).