Back chapter figures
Figure 9.23
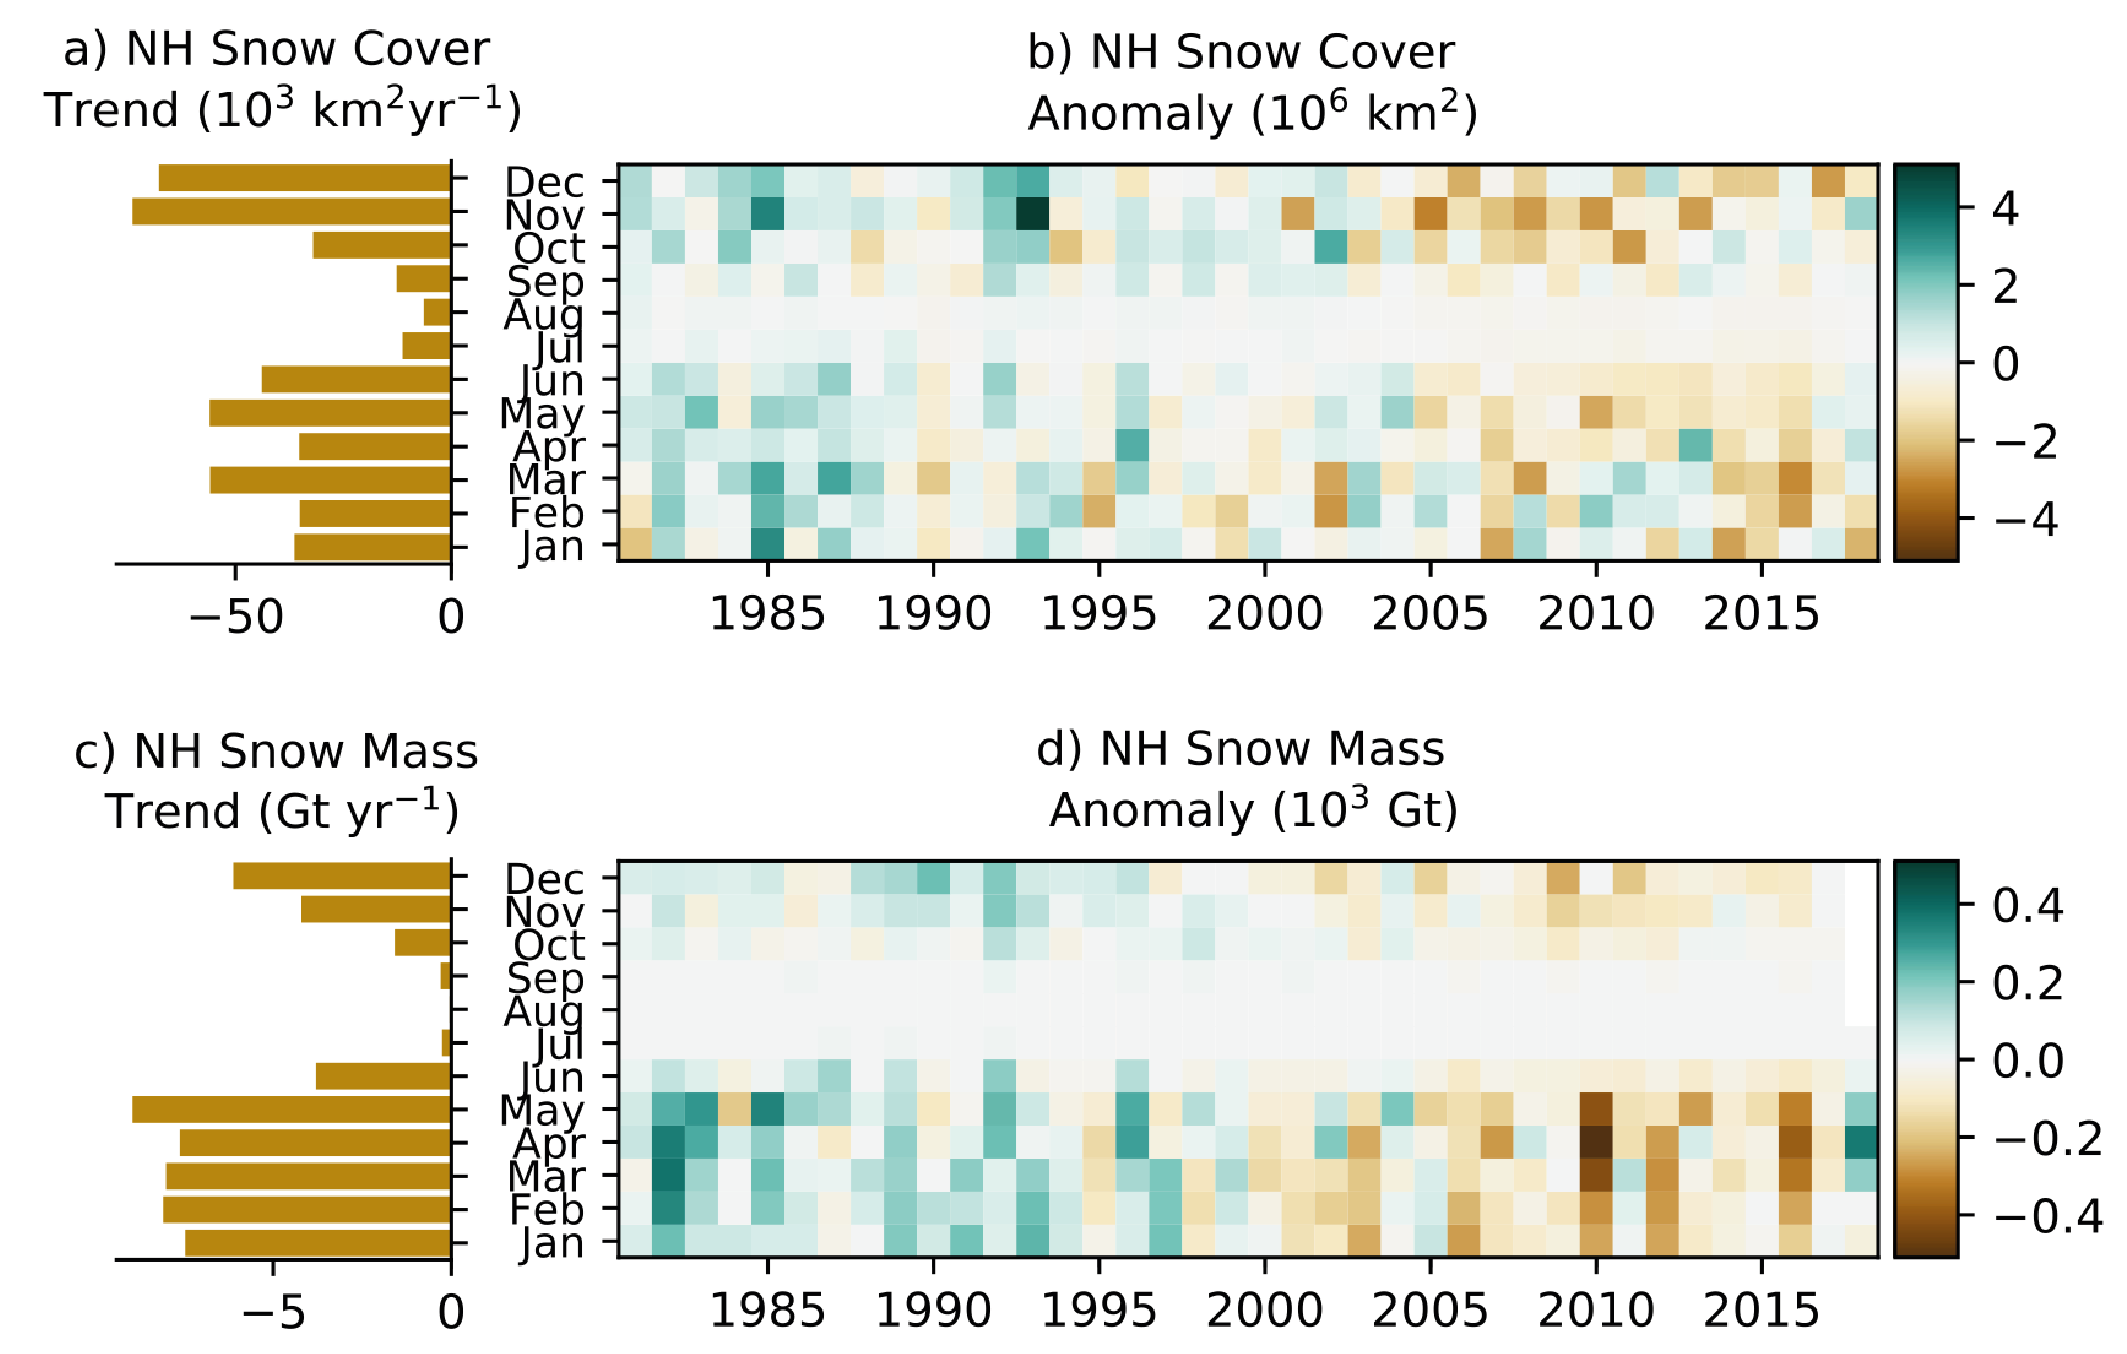
Figure caption
Figure 9.233 | Observed monthly Northern Hemisphere snow cover (a) trends and (b) anomalies, and snow mass (c) trends and (d) anomalies. From the observation-based ensemble discussed in the text (Mudryk et al., 2020). Trends and anomalies are calculated over the 1981–2018 period. Further details on data sources and processing are available in the chapter data table (Table 9.SM.9).