Back chapter figures
Figure 9.24
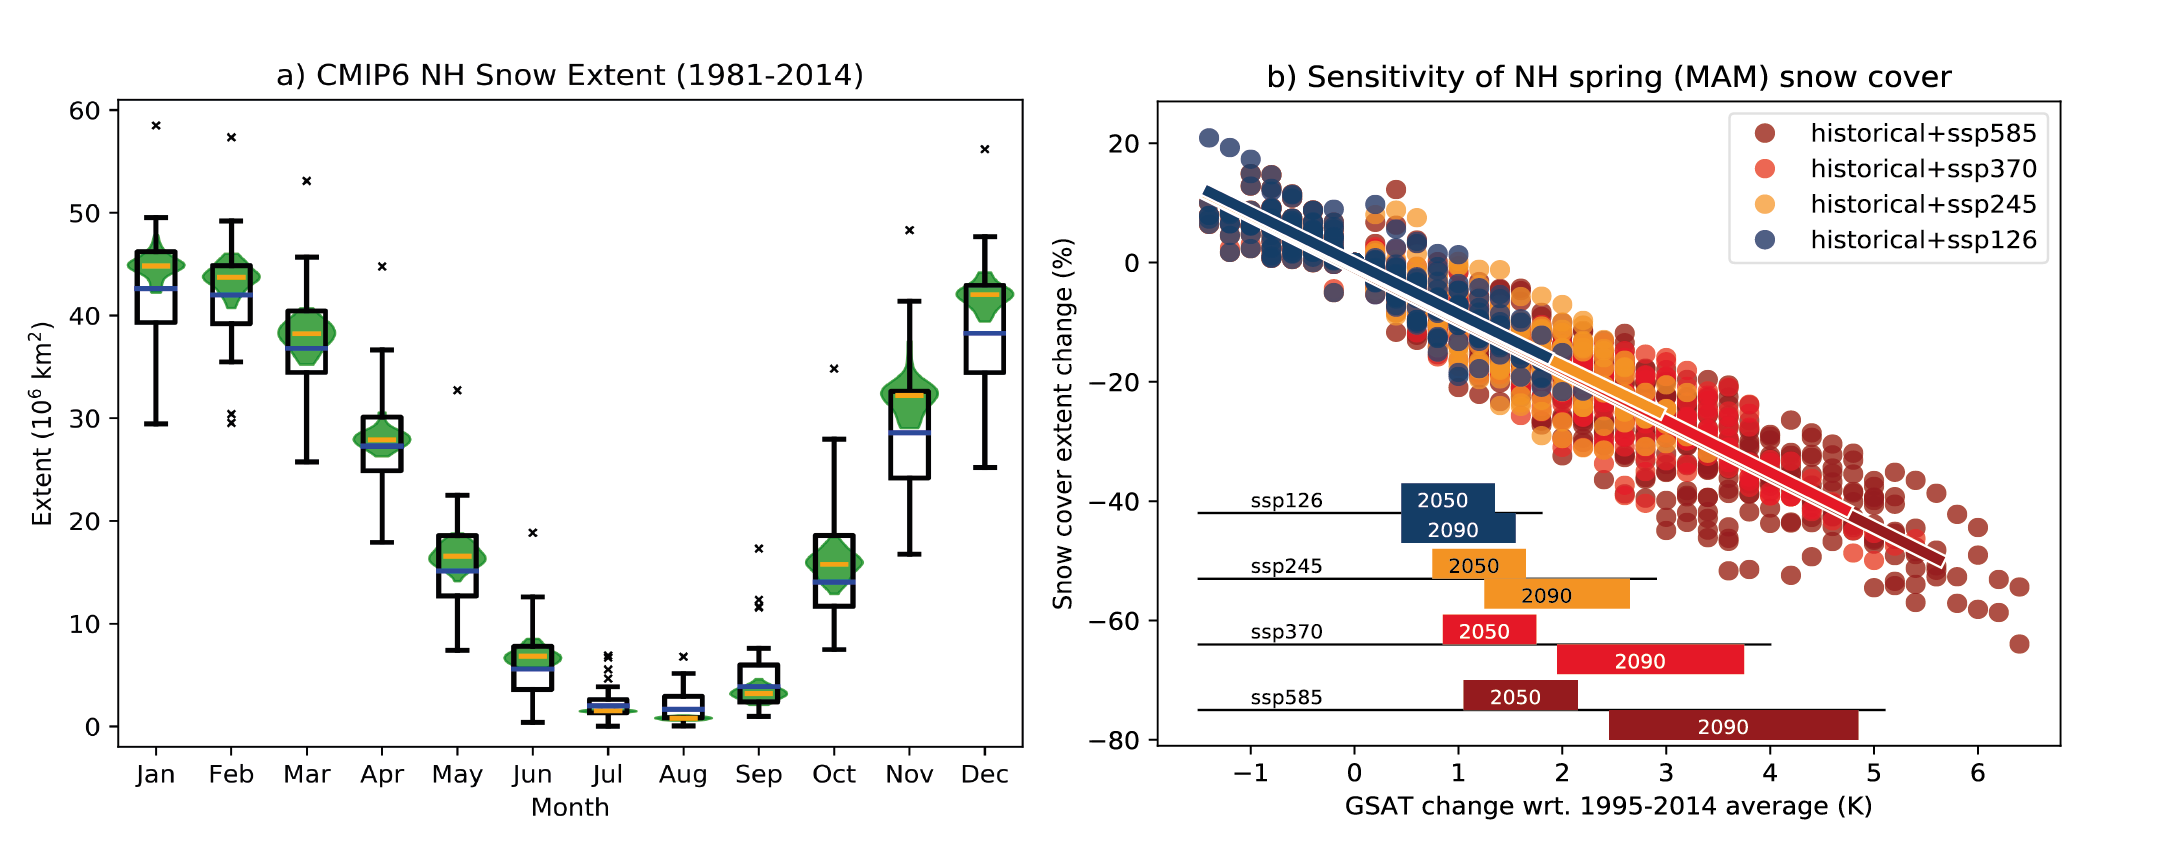
Figure caption
Figure 9.24 | Simulated Coupled Model Intercomparison Project Phase 6 (CMIP6) and observed snow cover extent (SCE). (a) Simulated CMIP6 and observed (Mudryk et al., 2020) SCE (in millions of km2) for 1981–2014. Boxes and whiskers with outliers represent monthly mean values for the individual CMIP6 models averaged over 1981–2014, with the red bar indicating the median of the CMIP6 multi-model ensemble for that period. The observed interannual distribution over the period is represented in green, with the yellow bar indicating the median. (b) Spring (March to May) Northern Hemisphere SCE against global surface air temperature (GSAT) (relative to the 1995–2014 average) for the CMIP6 Tier 1 scenarios (SSP1-2.6, SSP2-4.5, SSP3-7.0 and SSP5-8.5), with linear regressions. Each data point is the mean for one CMIP6 simulation (first ensemble member for each available model) in the corresponding temperature bin. Further details on data sources and processing are available in the chapter data table (Table 9.SM.9).