Back chapter figures
Figure 9.25
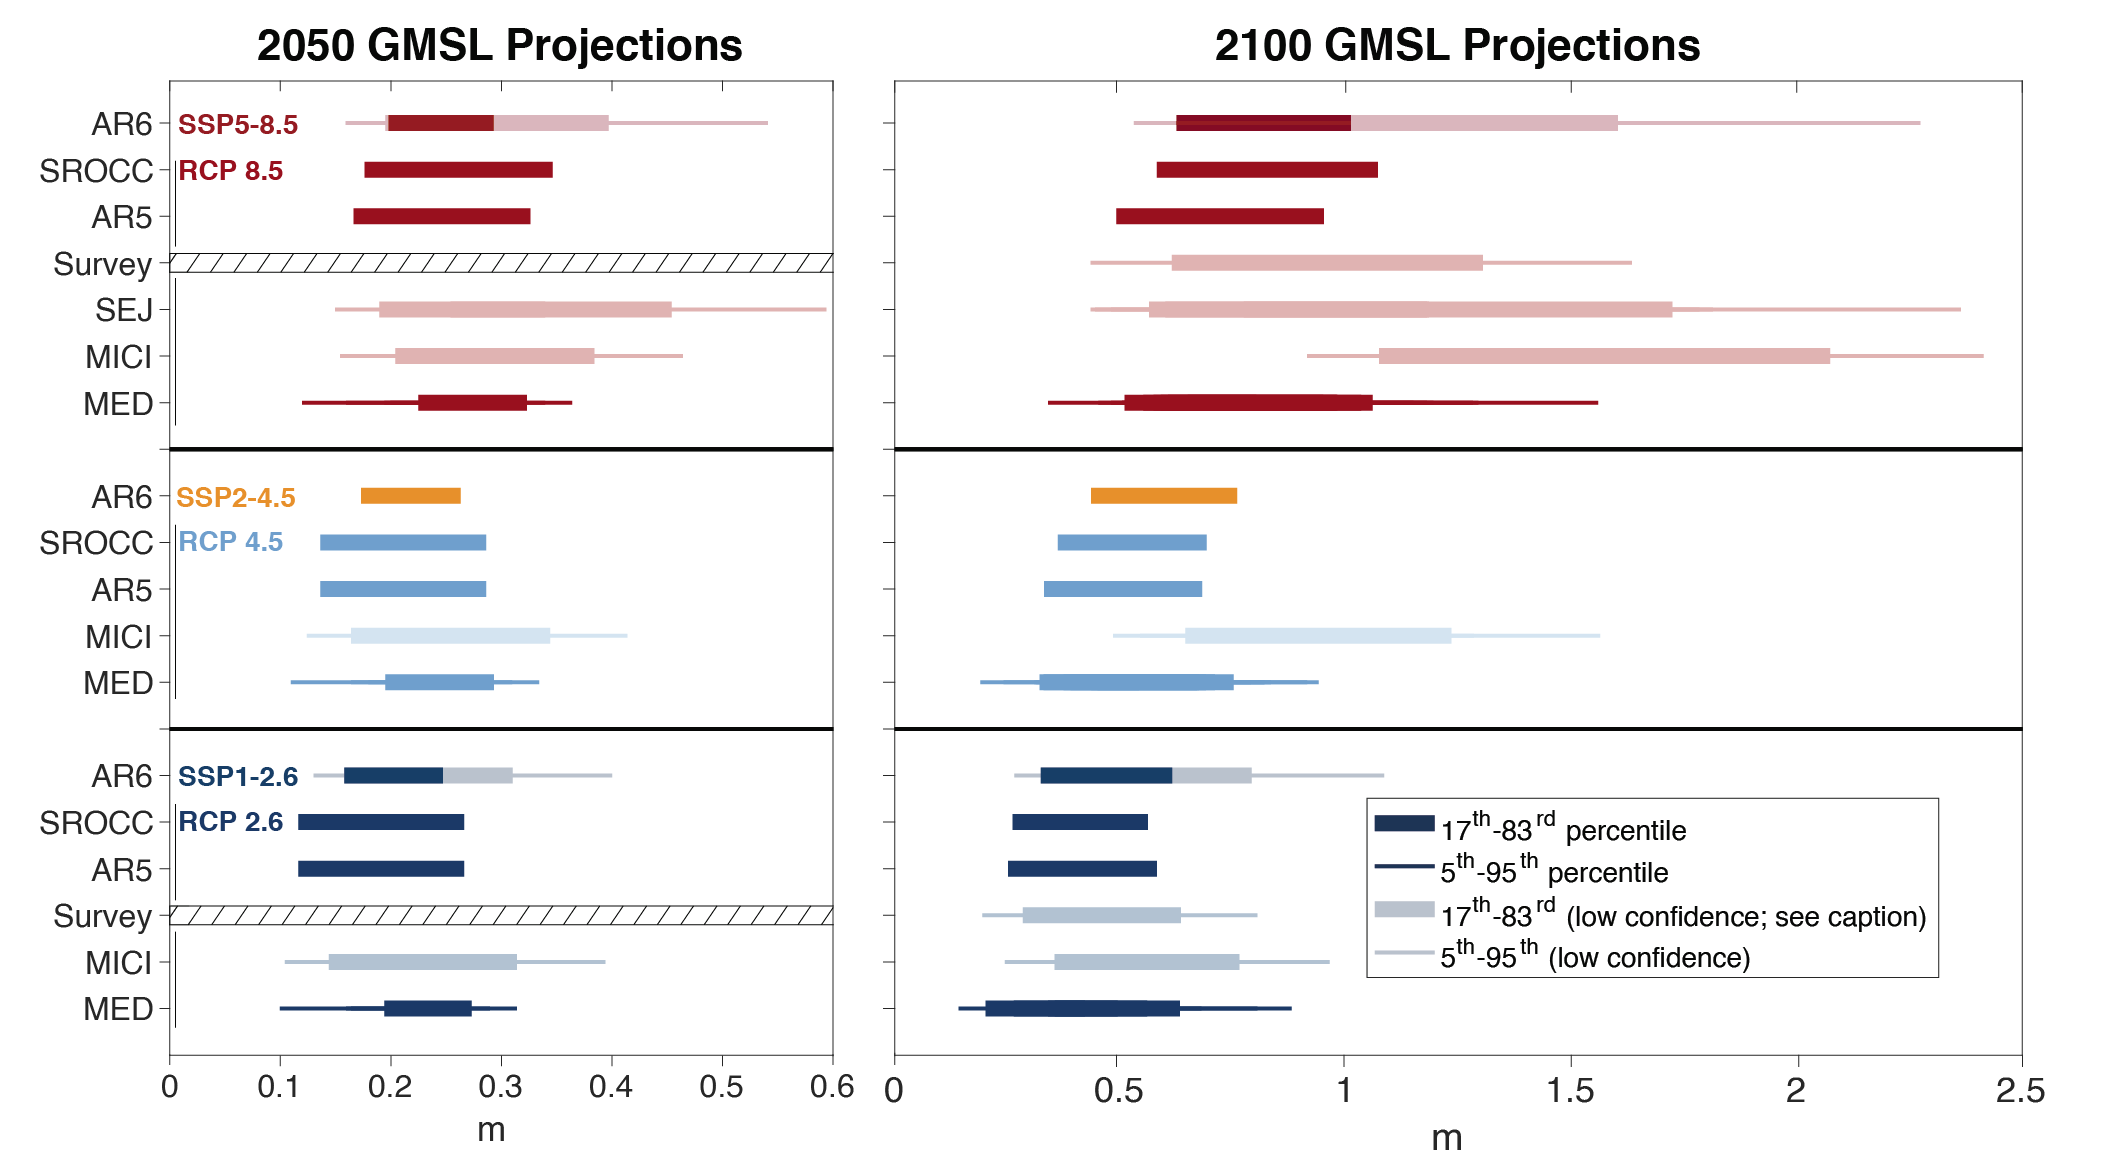
Figure caption
Figure 9.25 | Literature global mean sea level (GMSL) projections (m) for 2050 (left) and 2100 (right) since 1995–2014, for RCP8.5/SSP5-8.5 (top set), RCP4.5/SSP2-4.5 (middle set), and RCP2.6/SSP1-2.6 (bottom set). Projections are standardized to account for minor differences in time periods. Thick bars span from the 17th–83rd percentile projections, and thin bars span the 5th–95th percentile projections. The different assessments of ice-sheet contributions are indicated by ‘MED’ (ice-sheet projections include only processes in whose quantification there is medium confidence), ‘MICI’ (ice-sheet projections which incorporate marine ice cliff instability), and ‘SEJ’ (structured expert judgement) to assess the central range of the ice-sheet projection distributions. ‘Survey’ indicates the results of a 2020 survey of sea level experts on global mean sea level (GMSL) rise from all sources (Horton et al., 2020). Projection categories incorporating processes in which there is low confidence (MICI and SEJ) are lightly shaded. Dispersion among the different projections represents deep uncertainty, which arises as a result of low agreement regarding appropriate conceptual models describing ice-sheet behaviour and low agreement regarding probability distributions used to represent key uncertainties. Individual studies are shown in Tables 9.SM.5 and 9.SM.6. Further details on data sources and processing are available in the chapter data table (Table 9.SM.9).