Back chapter figures
Figure 9.26
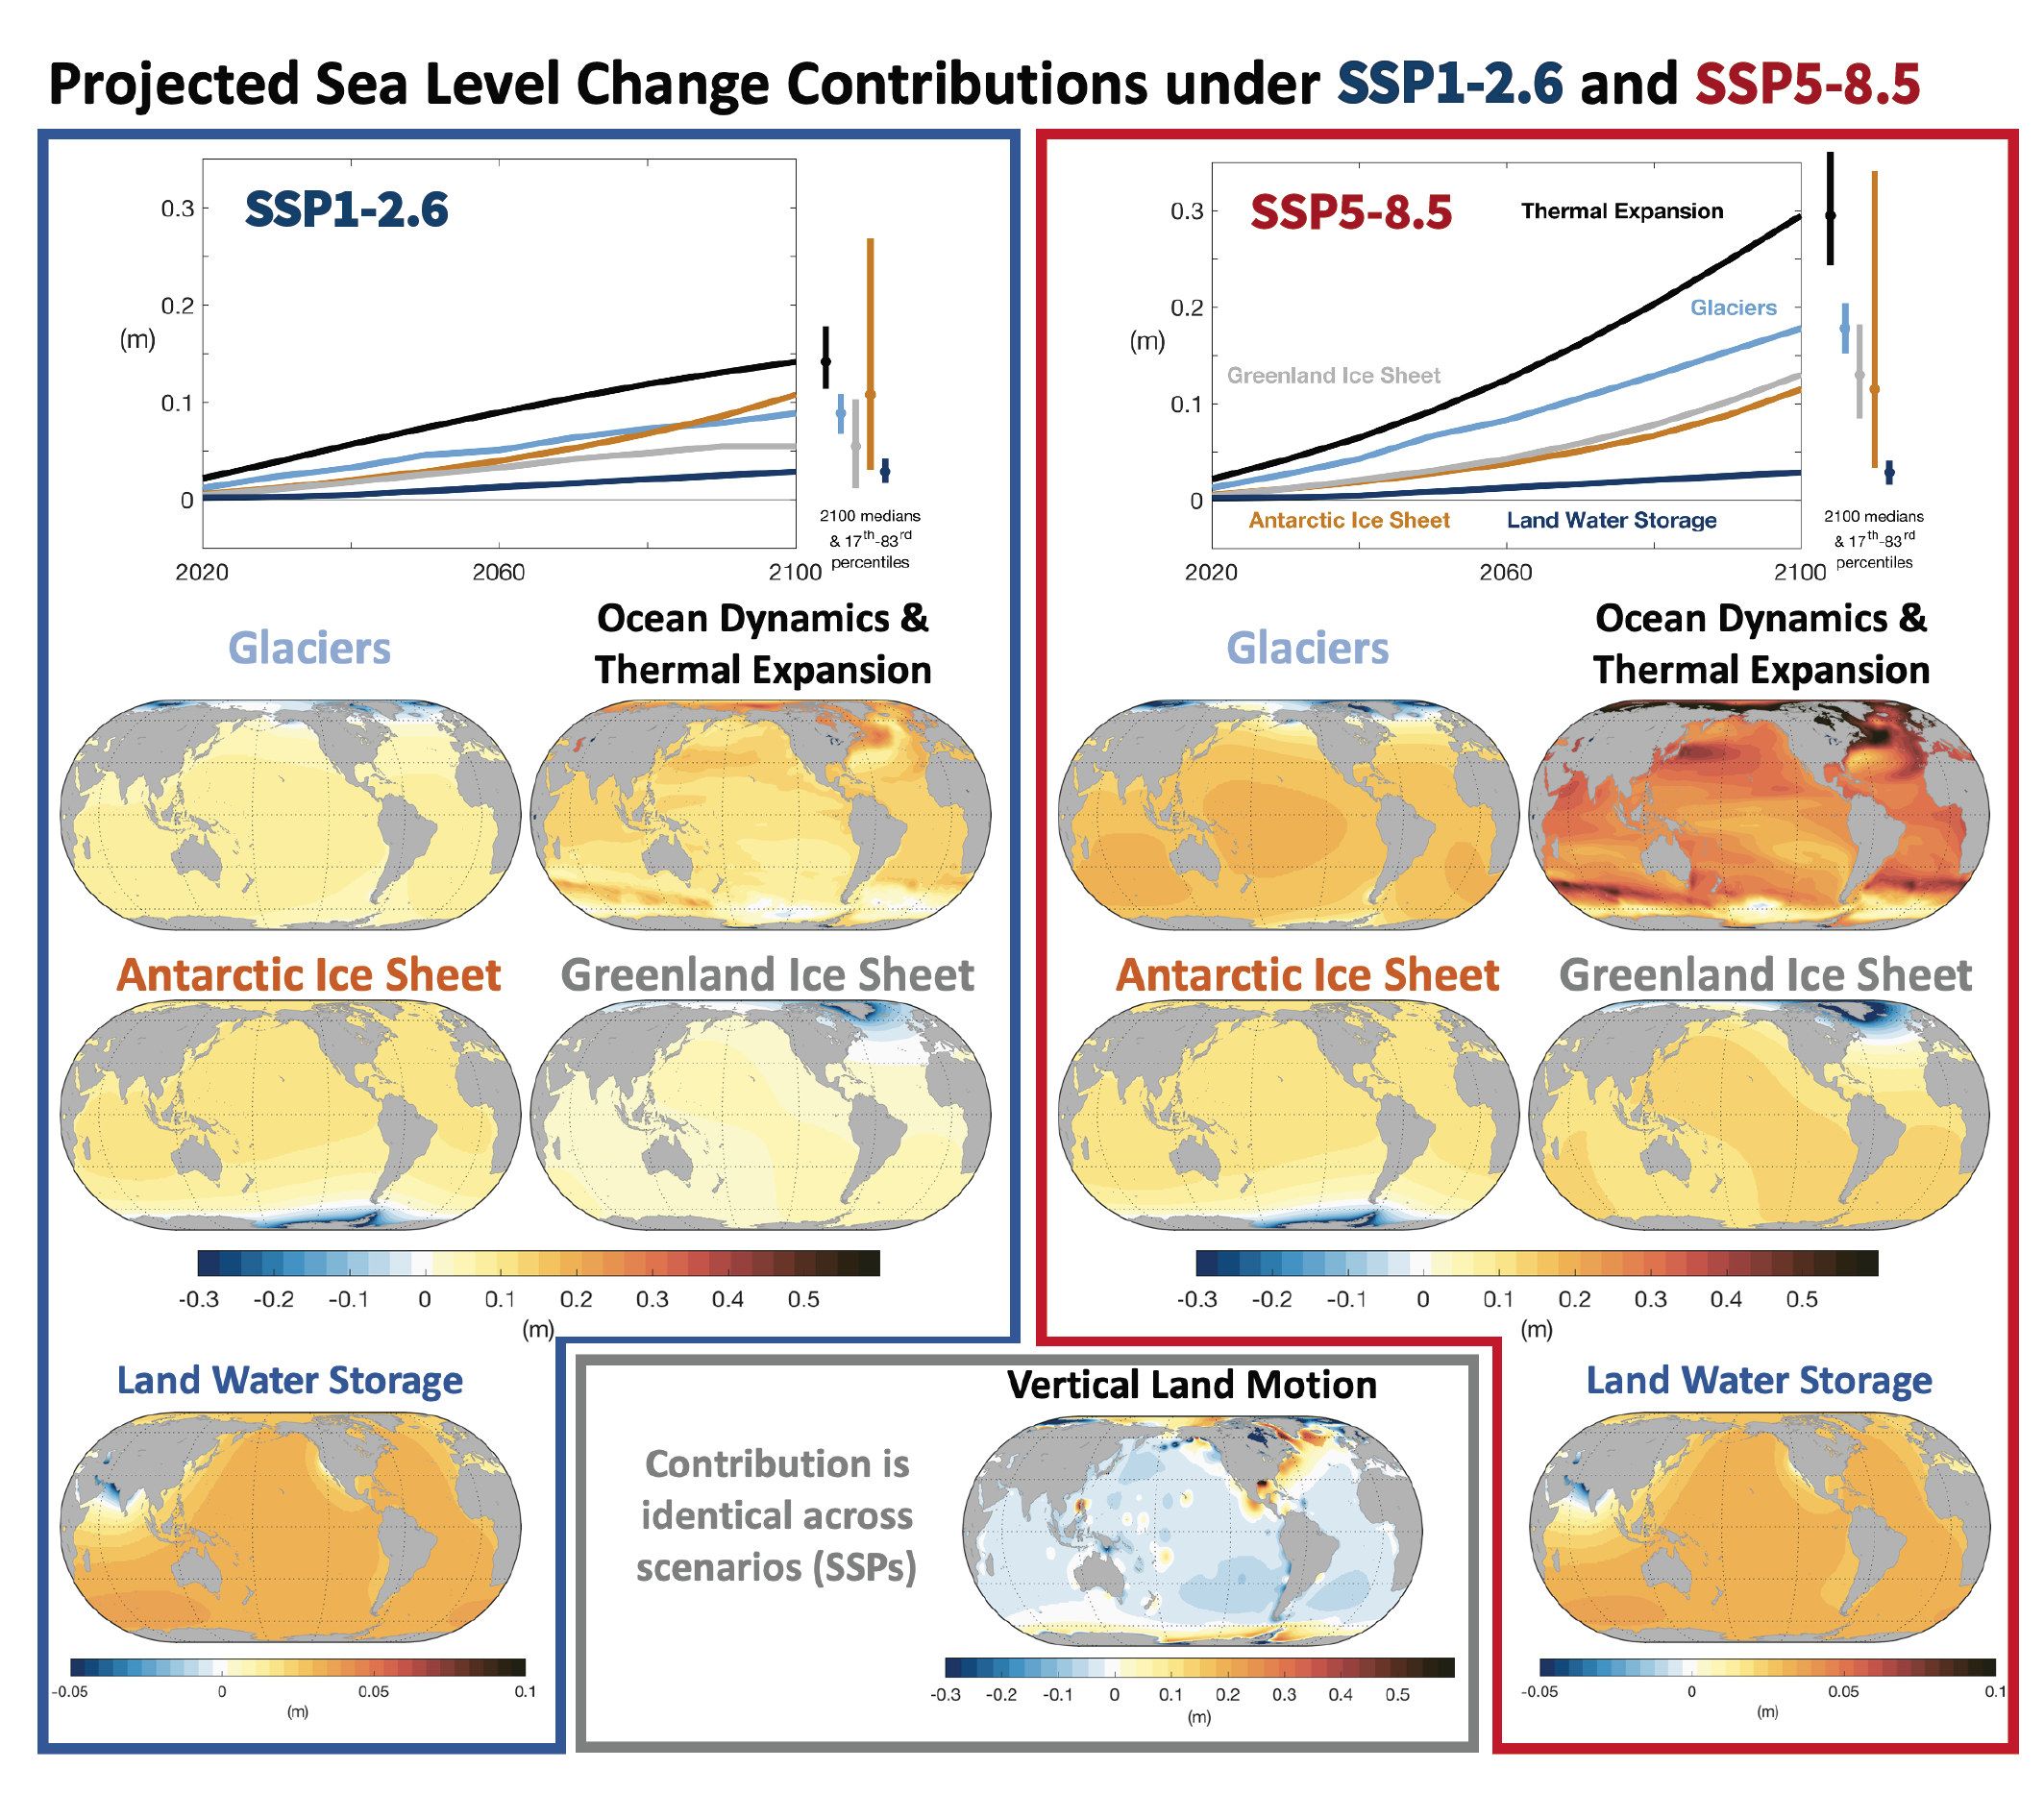
Figure caption
Figure 9.26 | Median global mean and regional relative sea level projections (m) by contribution for the SSP1-2.6 and SSP5-8.5 scenarios. Upper time series: Global mean contributions to sea level change as a function of time, relative to 1995–2014. Lower maps: Regional projections of the sea level contributions in 2100 relative to 1995–2014 for SSP5-8.5 and SSP1-2.6. Vertical land motion is common to both Shared Socio-economic Pathways (SSPs). Further details on data sources and processing are available in the chapter data table (Table 9.SM.9).