Back chapter figures
Figure 9.27
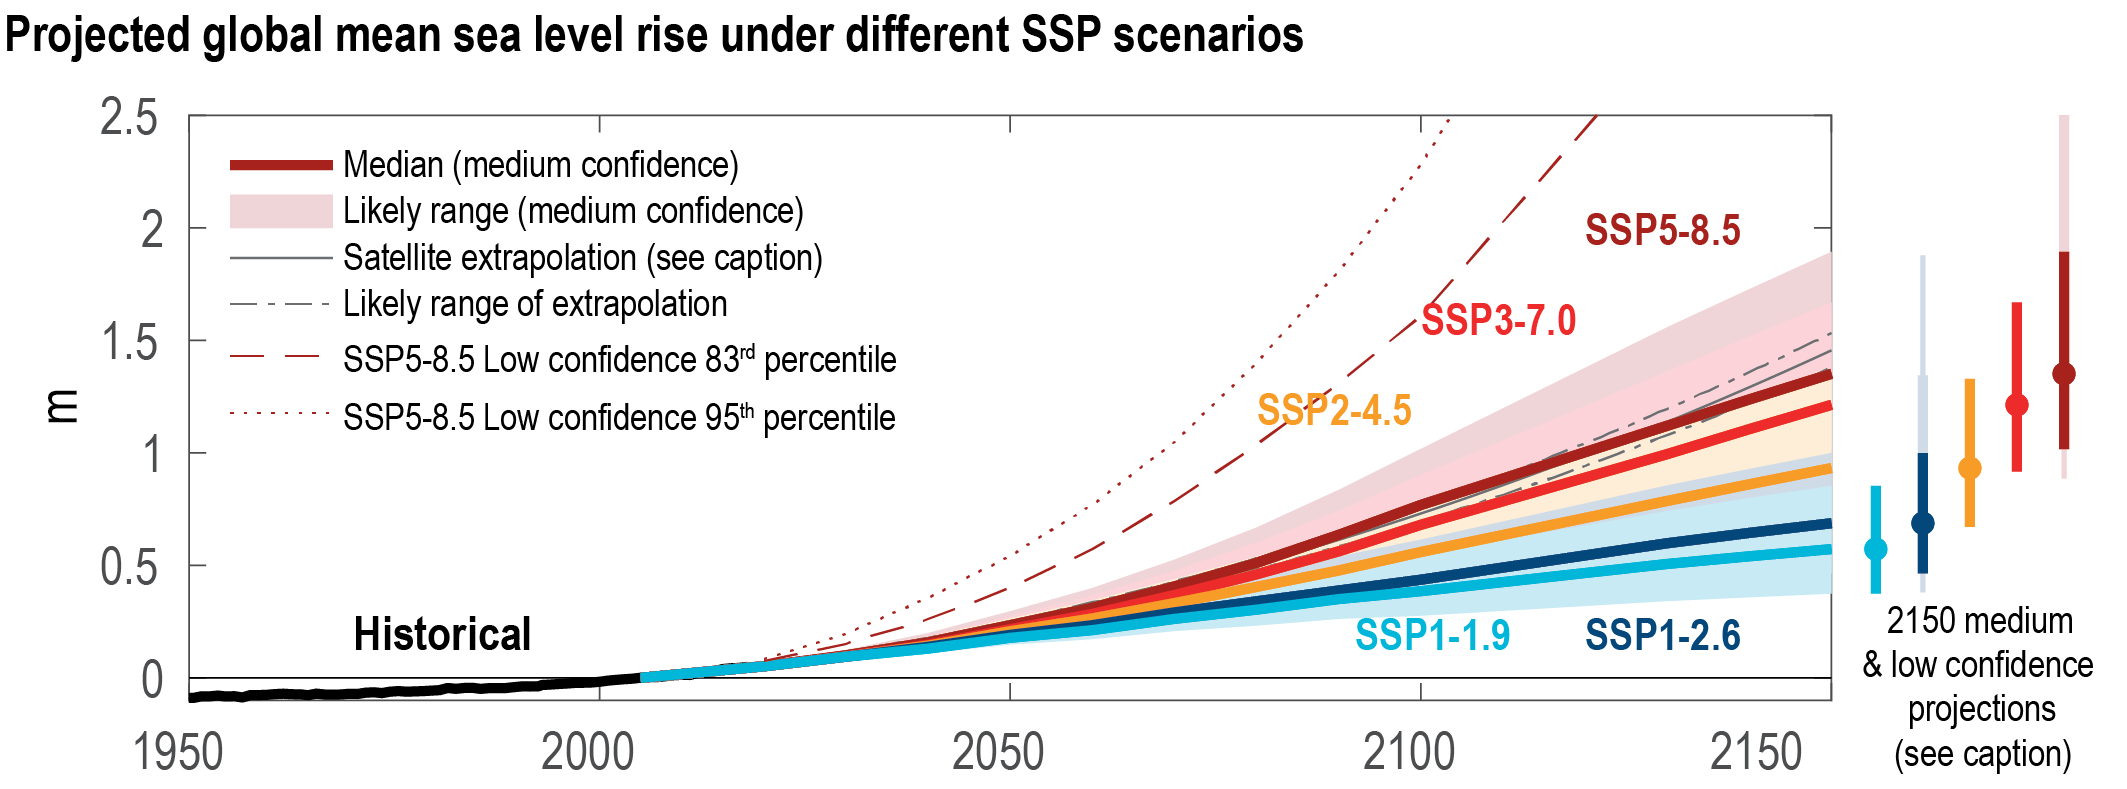
Figure caption
Figure 9.27 | Projected global mean sea level rise under different Shared Socio-economic Pathway (SSP) scenarios. Likely global mean sea level (GMSL) change for SSP scenarios resulting from processes in whose projection there is medium confidence. Projections and likely ranges at 2150 are shown on right. Lightly shaded ranges and thinner lightly shaded ranges on the right show the 17th–83rd and 5th–95th percentile ranges for projections including low confidence processes for SSP1-2.6 and SSP5-8.5 only, derived from a p-box including structured expert judgement and marine ice-cliff instability projections. Black lines show historical GMSL change, and thick solid and dash-dotted black lines show the mean and likely range extrapolating the 1993–2018 satellite altimeter trend and acceleration. Further details on data sources and processing are available in the chapter data table (Table 9.SM.9).