Back chapter figures
Figure 9.29
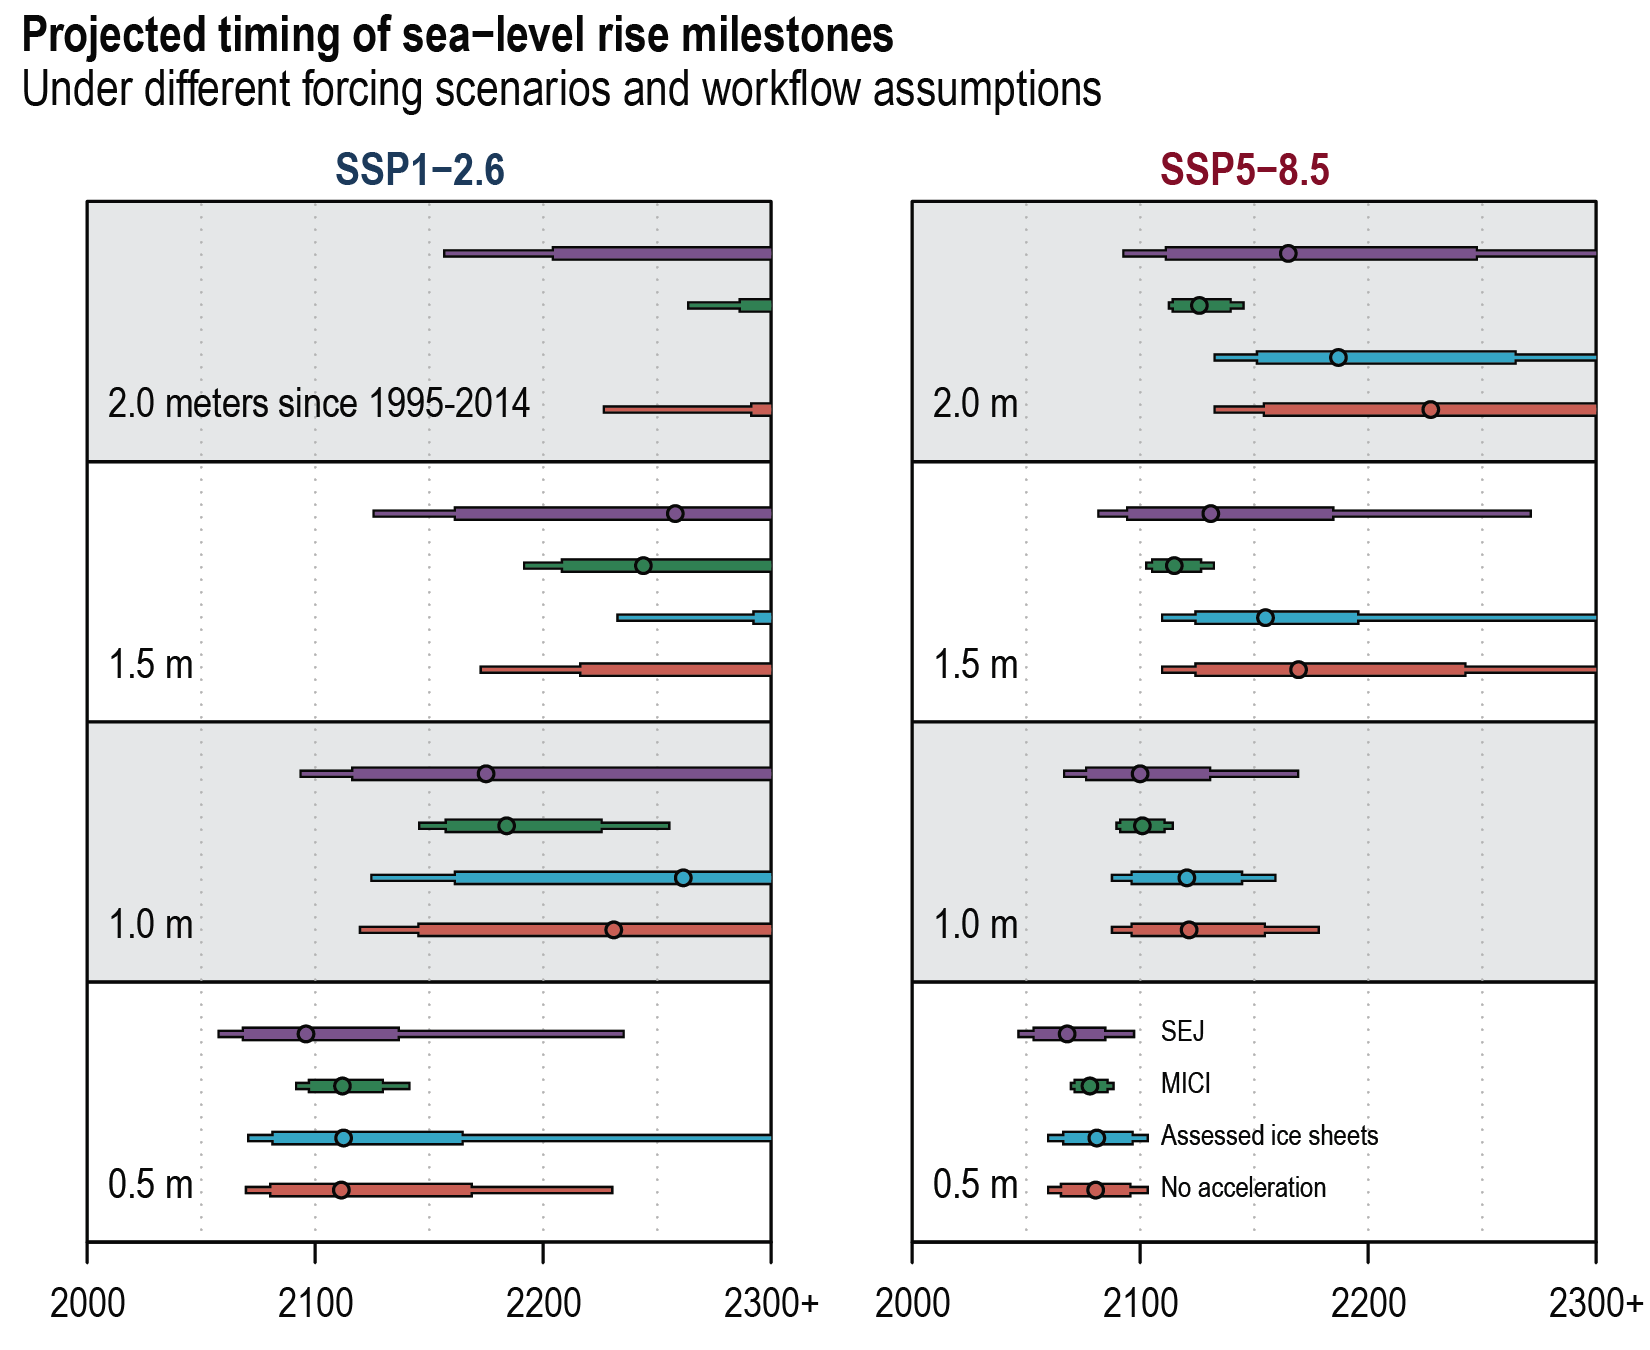
Figure caption
Figure 9.29 | Timing of when global mean sea level (GMSL) thresholds of 0.5, 1.0, 1.5 and 2.0 m are exceeded, based on four different ice-sheet projection methods informing post-2100 projections. Methods are labelled based on their treatment of ice sheets. ‘No acceleration’ assumes constant rates of mass change after 2100. ‘Assessed ice sheet’ models post-2100 ice-sheet losses using a parametric fit (Supplementary Material 9.SM.4) extending to 2300 based on a multi-model assessment of contributions under RCP2.6 and RCP8.5 at 2300. Structured expert judgement (SEJ) employs ice-sheet projections from Bamber et al. (2019). Marine ice-cliff instability (MICI) combines the parametric fit (Supplementary Material 9.SM3.4) for Greenland with Antarctic projections based on DeConto et al. (2021). Circles, thick bars and thin bars represent the 50th, 17th–83rd and 5th–95th percentiles of the exceedance timing for the indicated projection method. Further details on data sources and processing are available in the chapter data table (Table 9.SM.9).