Back chapter figures
Figure 9.3
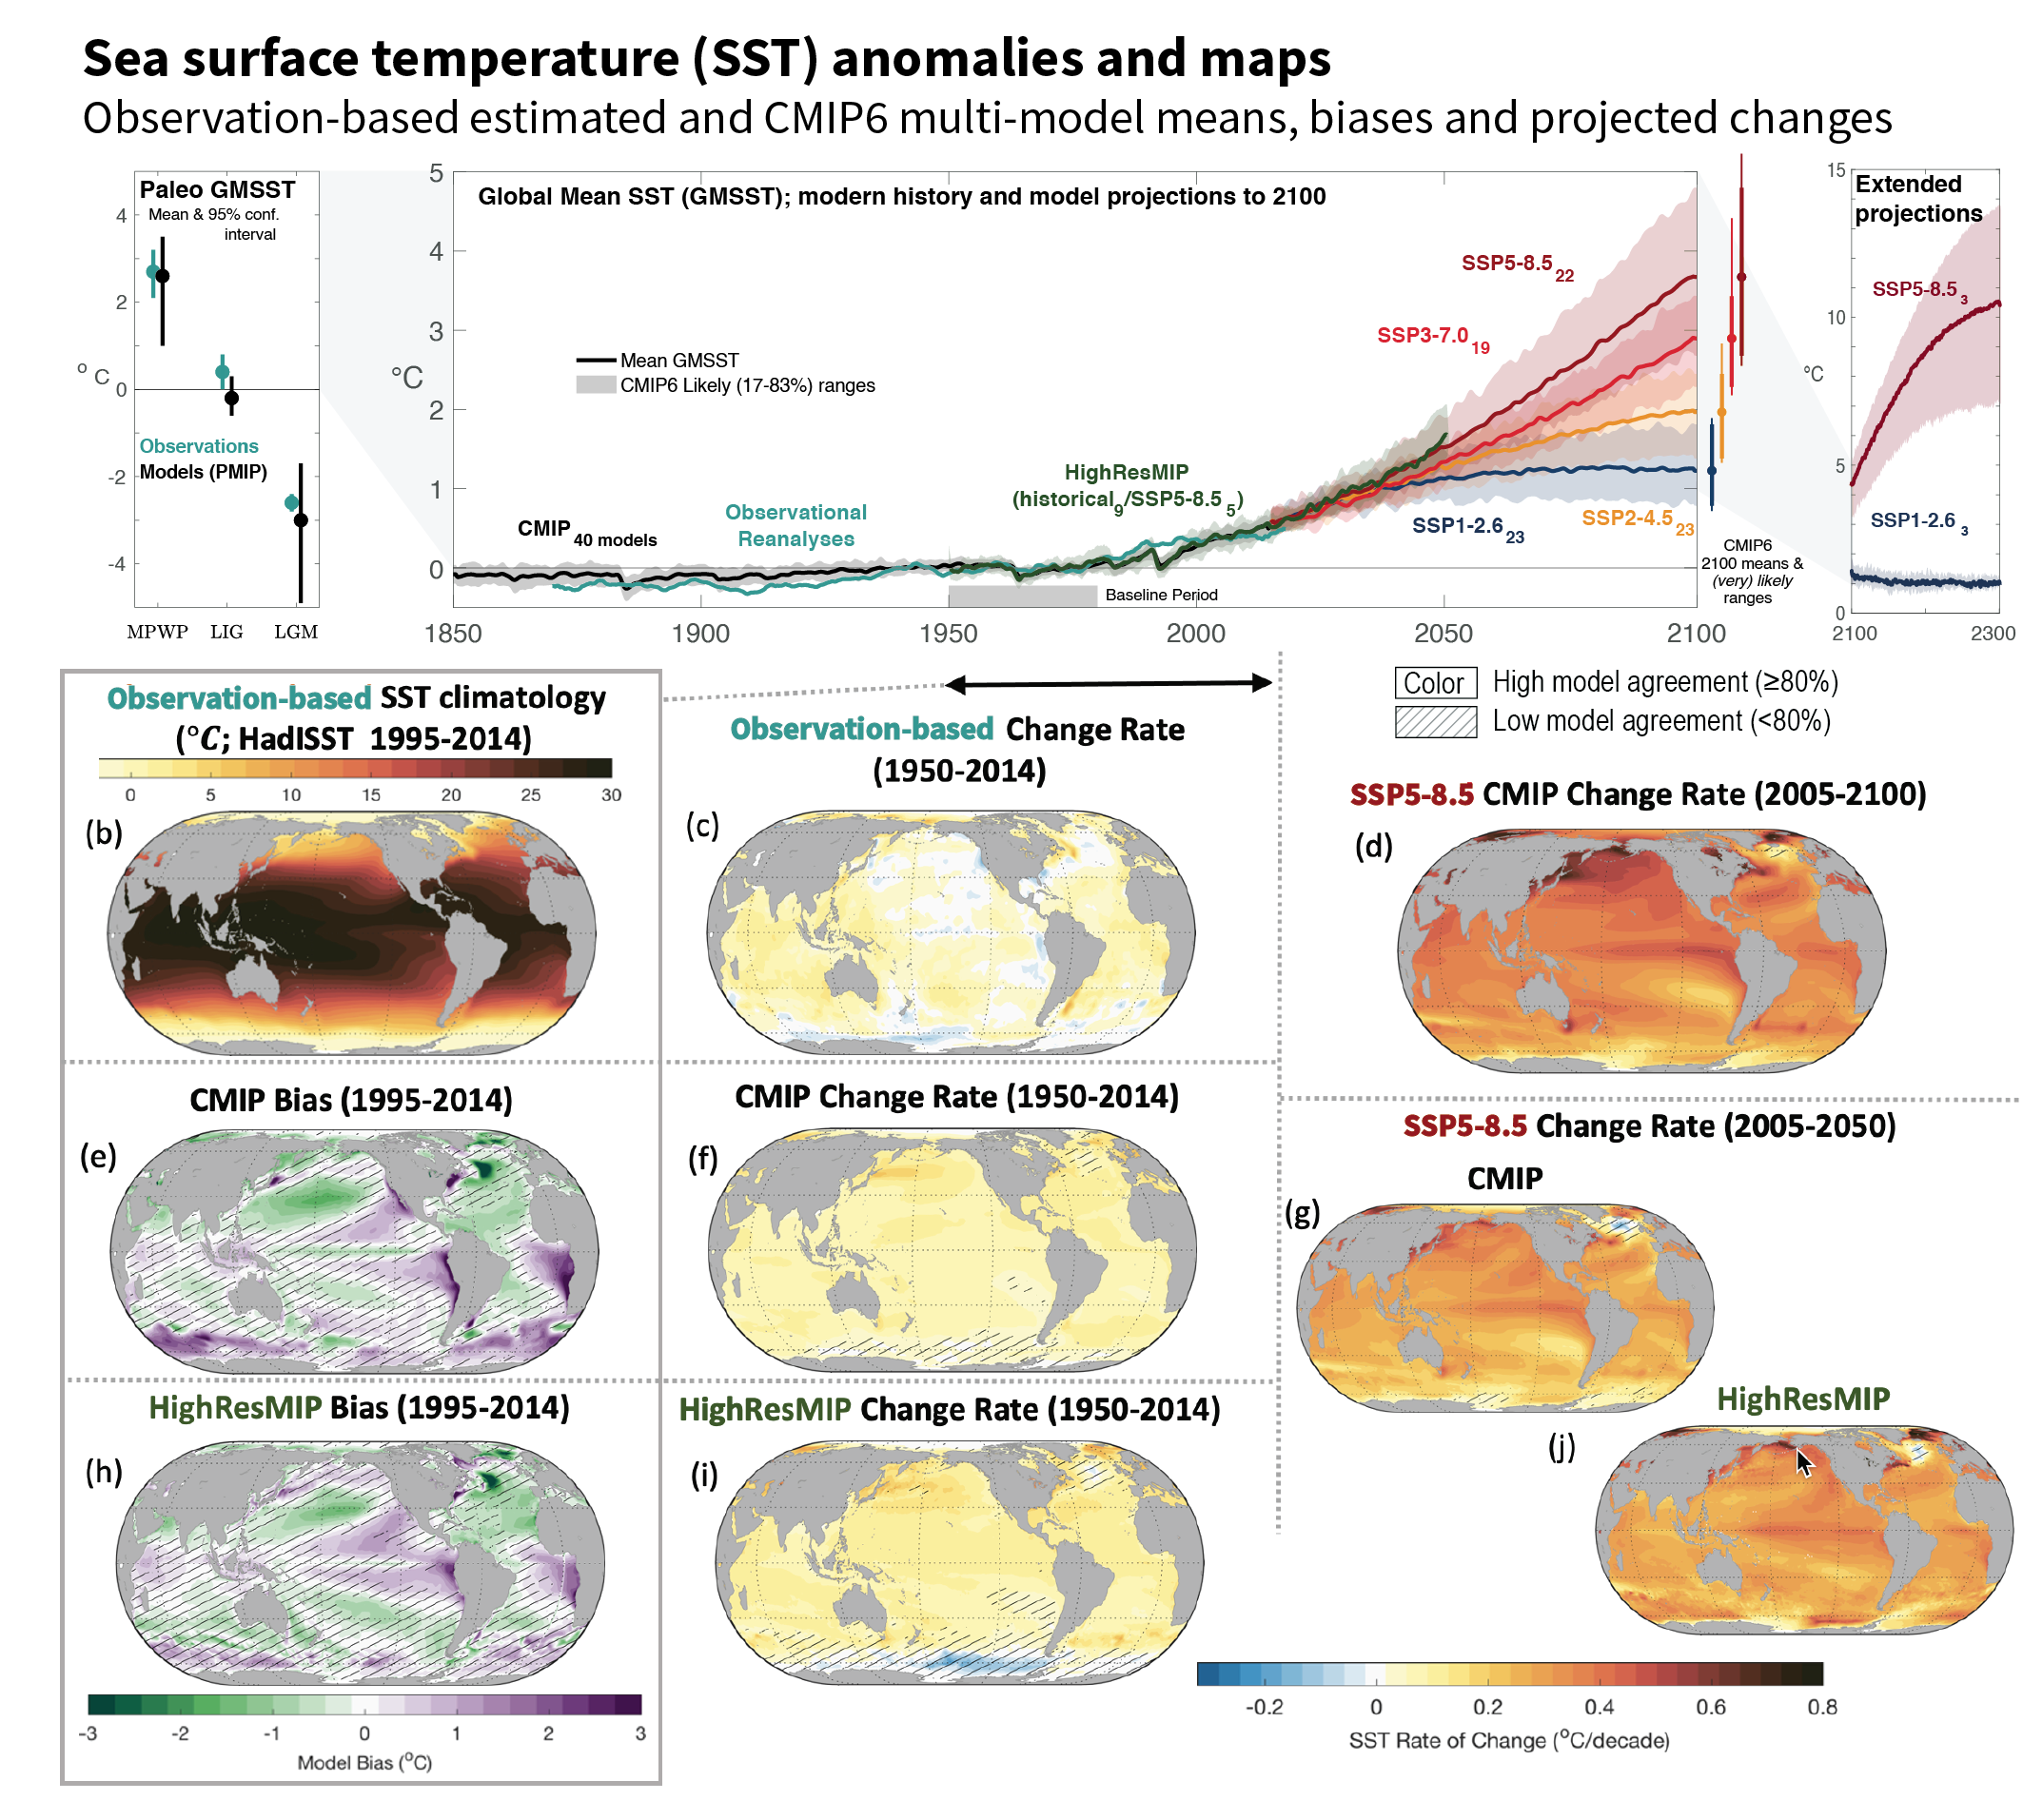
Figure caption
Figure 9.3 | Sea surface temperature (SST) and its changes with time. (a) Time series of global mean SST anomaly relative to 1950–1980 climatology. Shown are paleoclimate reconstructions and PMIP models, observational reanalyses (HadISST) and multi-model means from the Coupled Model Intercomparison Project (CMIP) historical simulations, CMIP projections, and HighResMIP experiment. (b) Map of observed SST (1995–2014 climatology HadISST). (c) Historical SST changes from observations. (d) CMIP 2005–2100 SST change rate. (e) Bias of CMIP. (f) CMIP change rate. (g) 2005–2050 change rate for SSP5-8.5 for the CMIP ensemble. (h) Bias of HighResMIP (bottom left) over 1995–2014. (i) HighResMIP change rate for 1950–2014. (j) 2005–2050 change rate for SSP5-8.5 for the HighResMIP ensemble. No overlay indicates regions with high model agreement, where ≥80% of models agree on sign of change. Diagonal lines indicate regions with low model agreement, where <80% of models agree on sign of change (see Cross-Chapter Box Atlas.1 for more information). Further details on data sources and processing are available in the chapter data table (Table 9.SM.9).