Back chapter figures
Figure 9.30
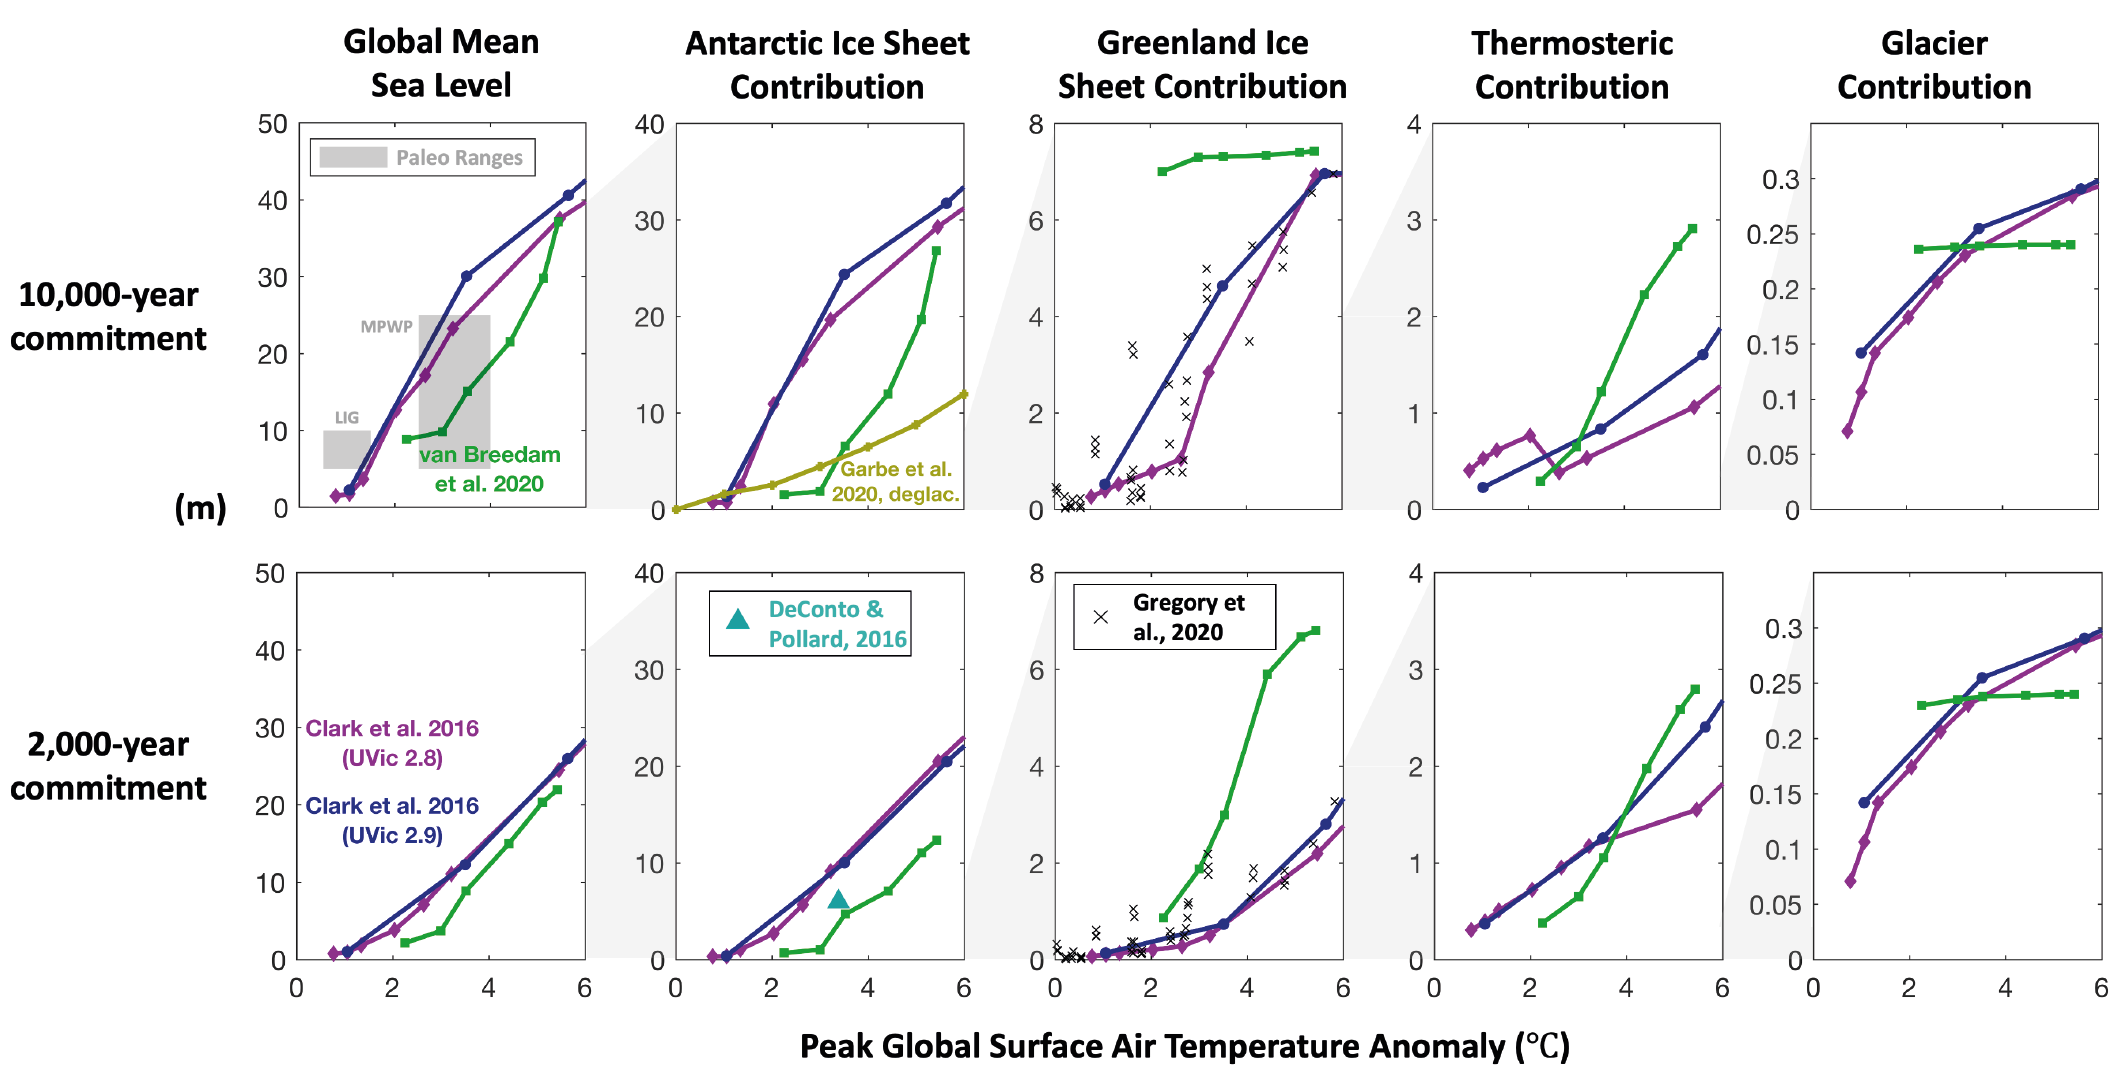
Figure caption
Figure 9.30 | Global mean sea level (GMSL) commitment as a function of peak global surface air temperature. From models (Clark et al., 2016; DeConto and Pollard, 2016; Garbe et al., 2020; Van Breedam et al., 2020) and paleo data on 2000-year (lower row) and 10,000 year (upper row) time scales. Columns indicate different contributors to GMSL rise (from left to right: total GMSL change, Antarctic Ice Sheet, Greenland Ice Sheet, global mean thermosteric sea level rise, and glaciers). Further details on data sources and processing are available in the chapter data table (Table 9.SM.9).