Back chapter figures
Figure 9.31
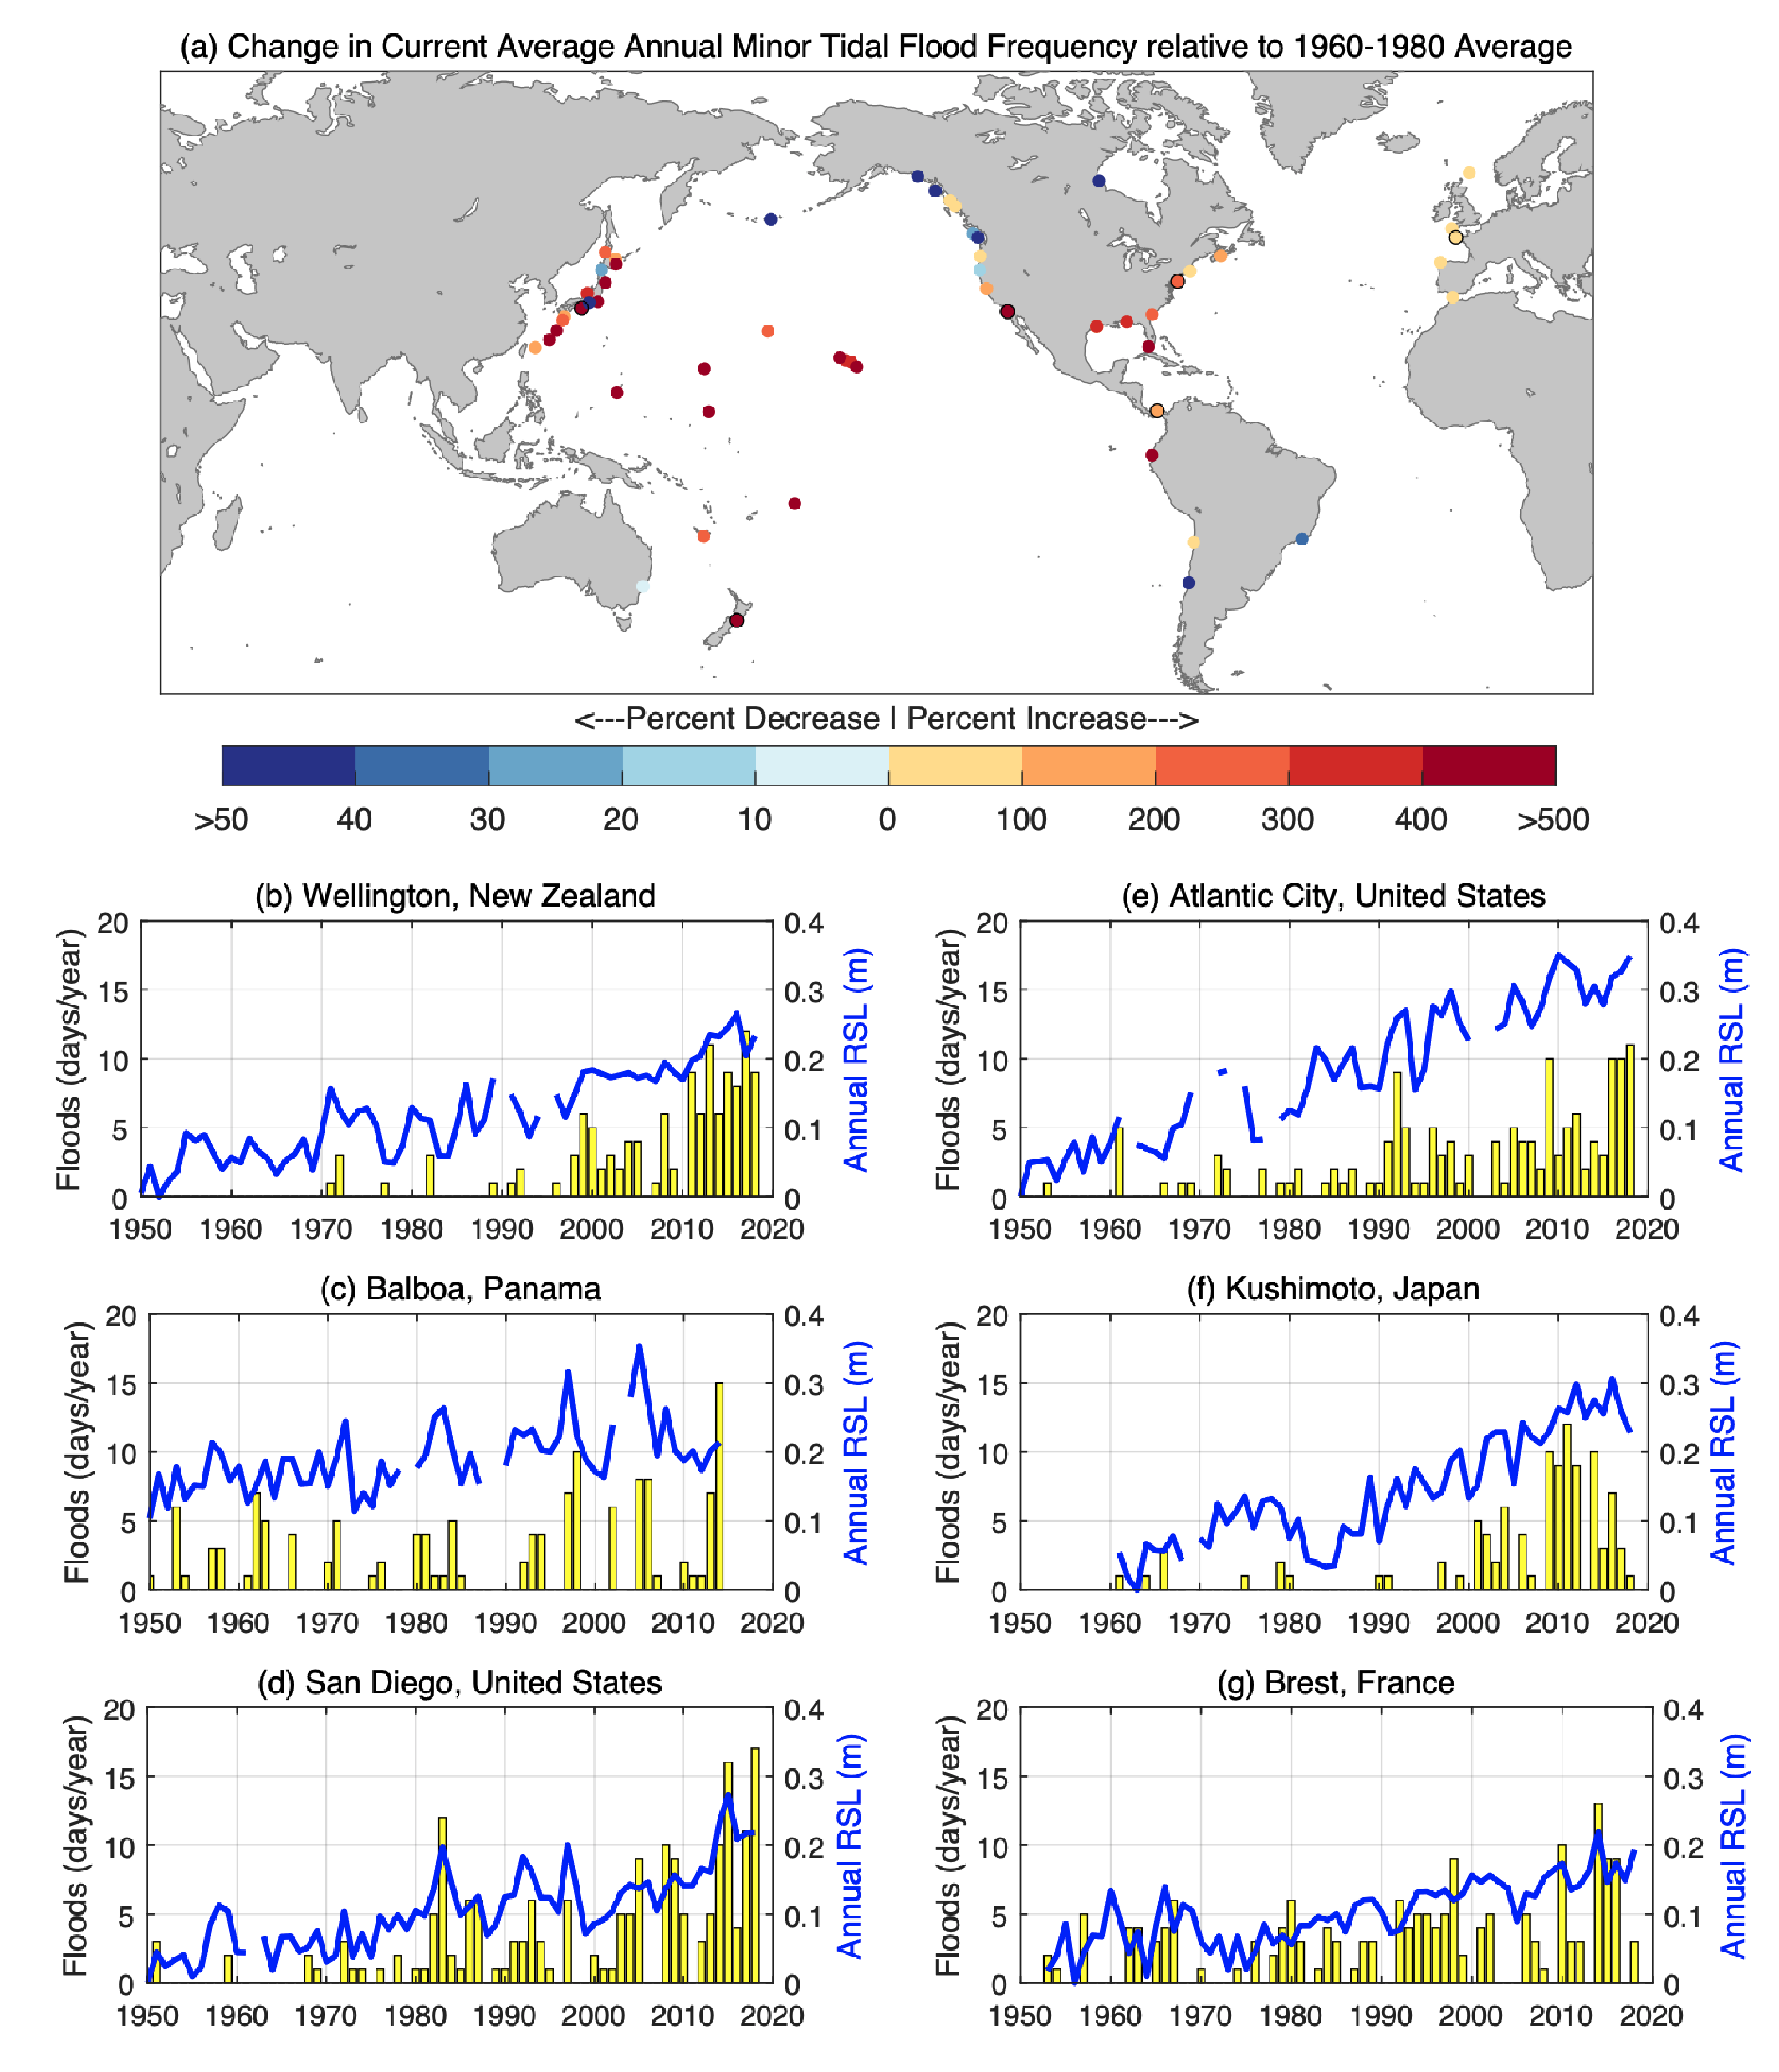
Figure caption
Figure 9.31 | Historical occurrences of minor extreme still water levels. Defined as the 99th percentile of daily observed water levels over 1995–2014. (a) Percent change in occurrences over 1995–2014 relative to those over 1960–1980. (b–g) Annual mean sea level (blue) and annual occurrences of extreme still water levels over the 1995–2014 99th percentile daily maximum (yellow) at six selected tide gauge locations. Further details on data sources and processing are available in the chapter data table (Table 9.SM.9).