Back chapter figures
Figure 9.4
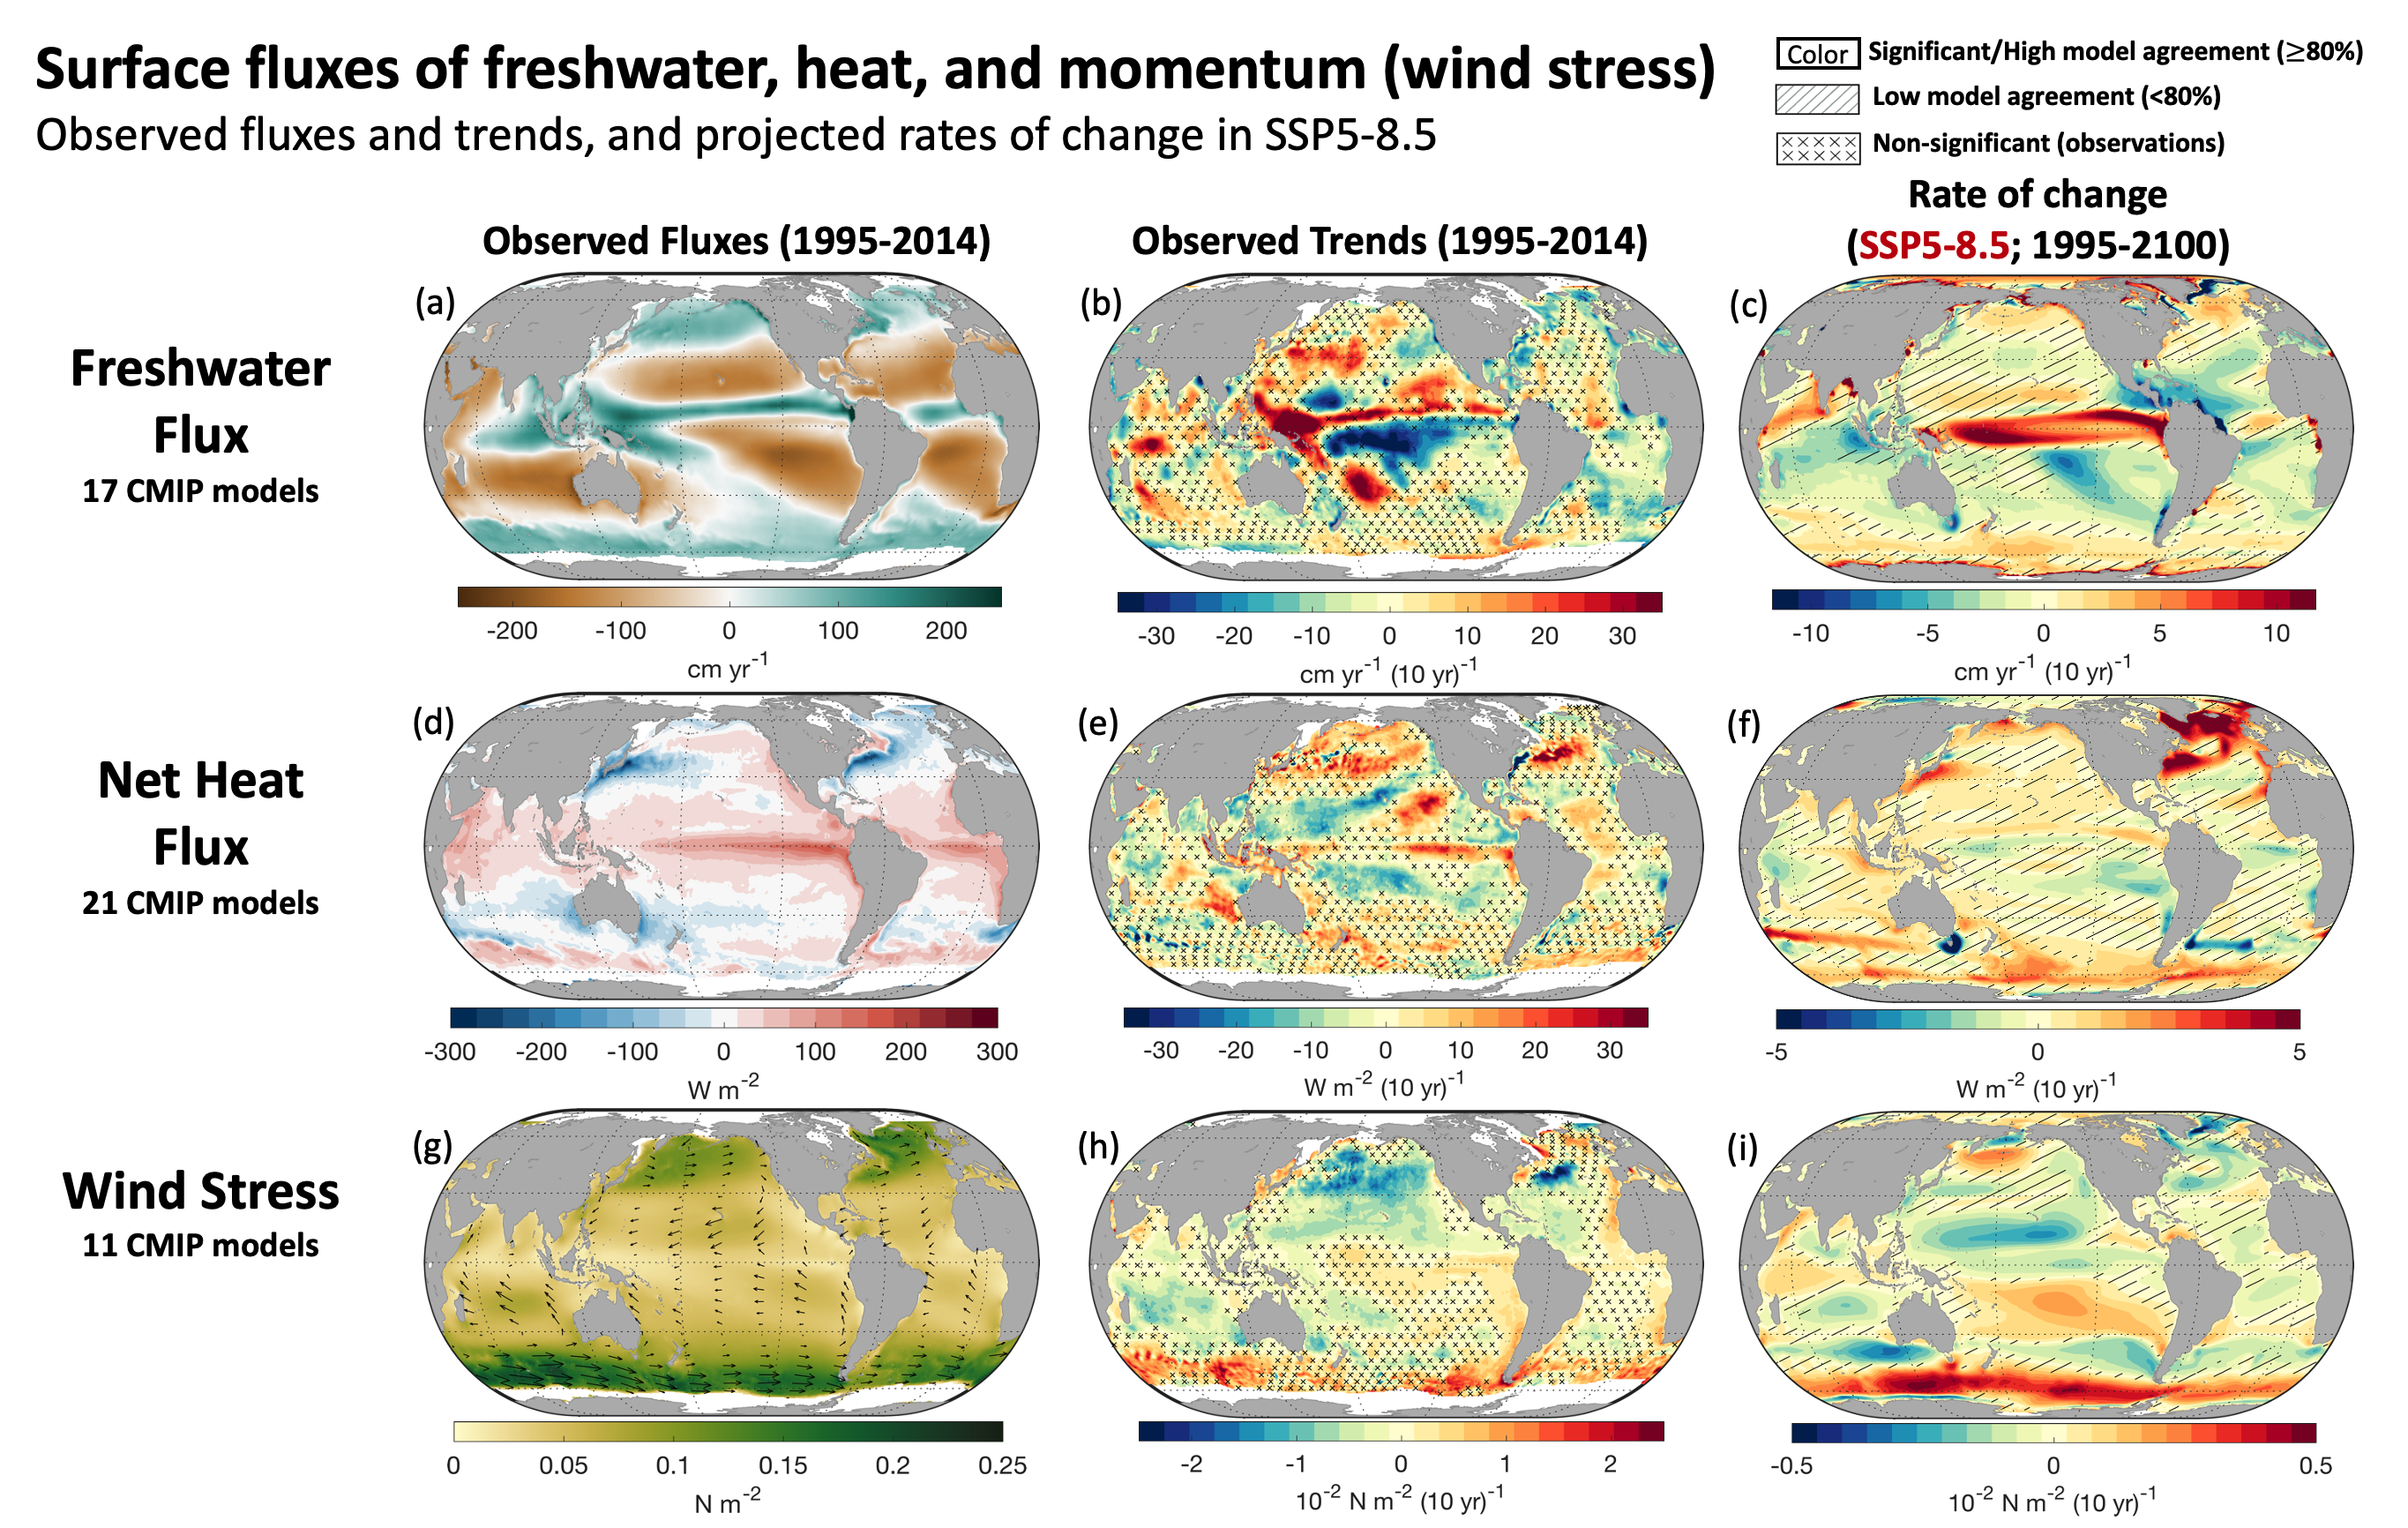
Figure caption
Figure 9.4 | Global maps of observed mean fluxes (a, d, g), the observed trends in these fluxes (b, e, h) and the projected rate of change in these fluxes from SSP5-8.5 (c, f, i). Shown are the freshwater flux (a–c), net heat flux (d–f), and momentum flux or wind stress magnitude (g–i), with positive numbers indicating ocean freshening, warming, and accelerating respectively. The means and observed trends are calculated between 1995–2014 (freshwater and wind stress) or 2001–2014 (heat). The SSP5-8.5 projected rates are between 1995–2100 using 20-year averages at each end of the time period. Observations show objective interpolation from Clouds and the Earth’s Radiant Energy System (CERES) Energy Balanced and Filled (EBAF) v4 (Kato et al., 2018), Objectively Analyzed air–sea Fluxes-High Resolution (OAFlux-HR) (Yu, 2019), and Global Precipitation Climatology Project (GPCP) (Adler et al., 2003) of fluxes and flux trends (b, e, h). Observed trends with no overlay indicate regions where the trends are significant at p = 0.34 level. Crosses indicate regions where trends are not significant. For (c, f, i) projections, no overlay indicates regions with high model agreement, where ≥80% of models agree on the sign of change. Diagonal lines indicate regions with low model agreement, where <80% of models agree on the sign of change (see Cross-Chapter Box Atlas.1 for more information). Further details on data sources and processing are available in the chapter data table (Table 9.SM.9).