Back chapter figures
Figure 9.5
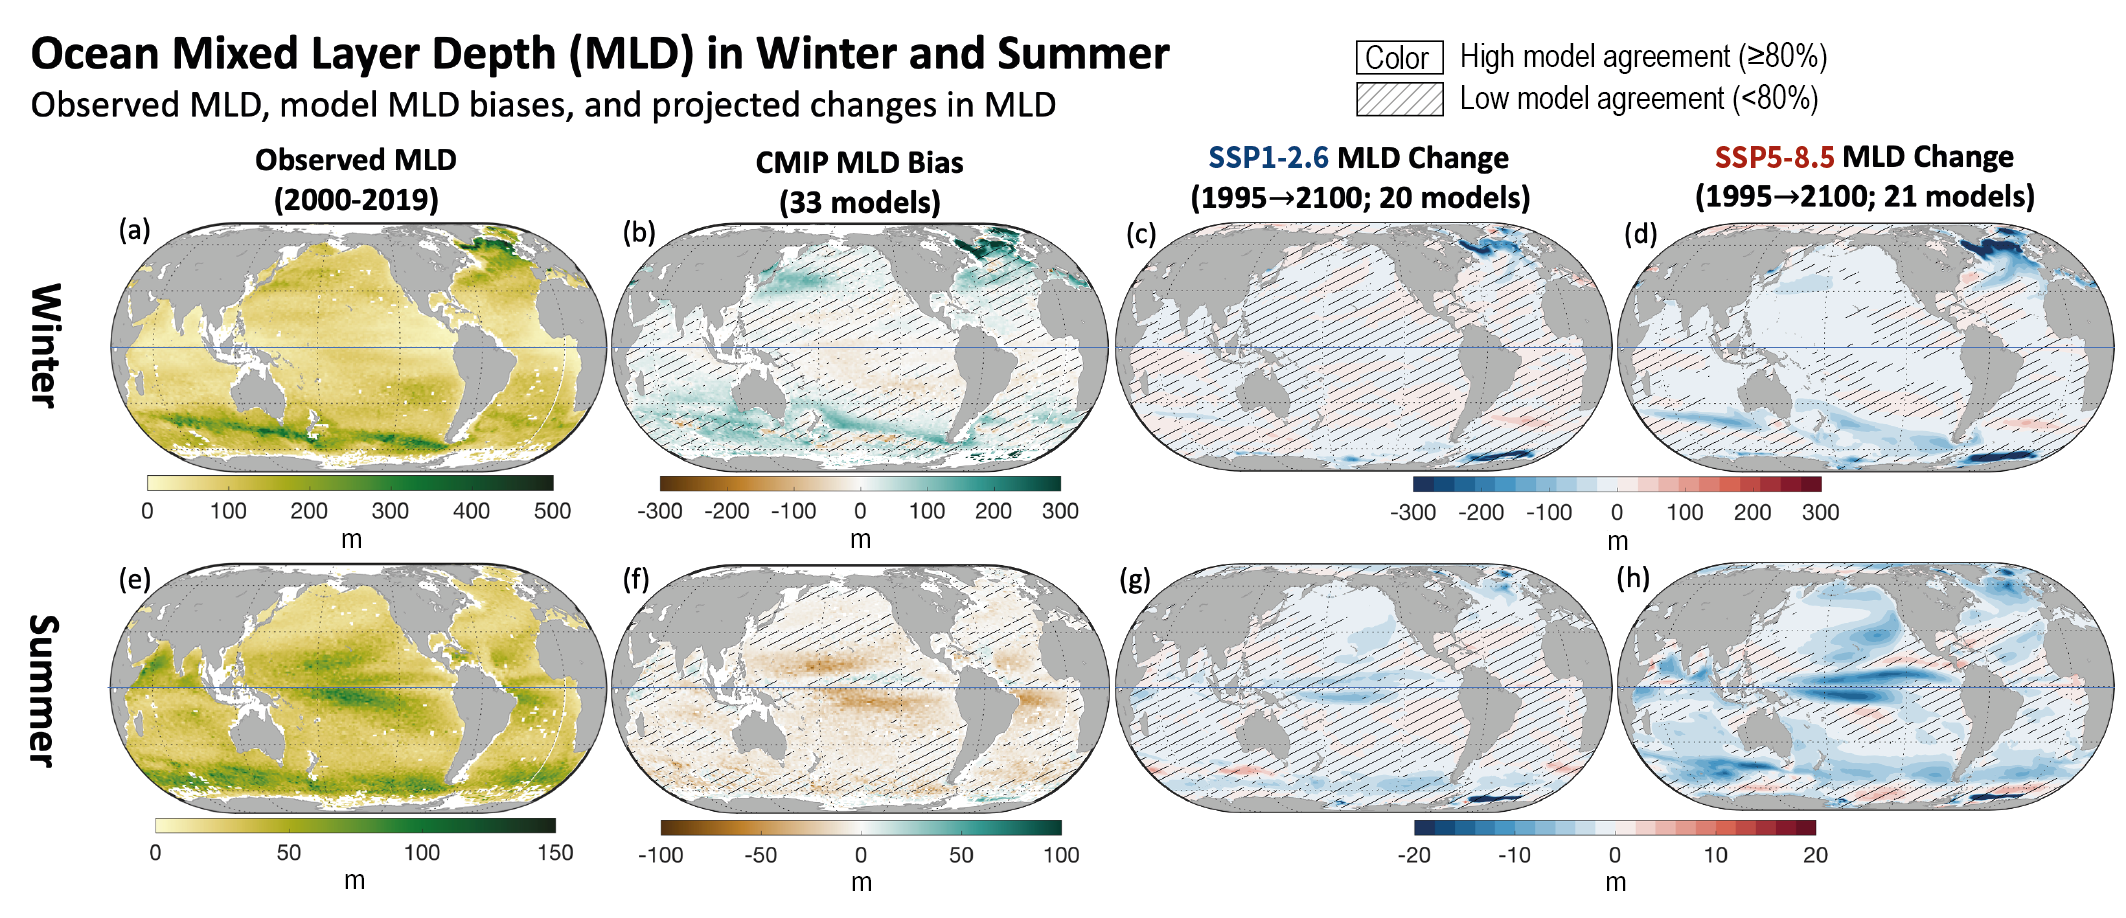
Figure caption
Figure 9.5 | Mixed-layer depth in (a–d) winter and (e–h) summer. (a, e) Observed climatological mean mixed-layer depth (based on density threshold) from the Argo Mixed Layer Depth Climatology (Holte et al., 2017) usingobservations for 2000–2019. (b, f) Bias between the observation-based estimate (2000–2019) and the 1995–2014 Coupled Model Intercomparison Project Phase 6 (CMIP6) climatological mean mixed-layer depth. (c, d, g, h) Projected mixed-layer depth (MLD) change from 1995–2014 to 2081–2100 under (c, g) SSP1-2.6 and (d, h) SSP5-8.5 scenarios. The (a–d) winter row shows December–January–February (DJF) in the Northern Hemisphere and June–July–August (JJA) in the Southern Hemisphere; The (e–h) summer row shows JJA in the Northern Hemisphere and DJF in the Southern Hemisphere. The mixed-layer depth is the depth where the potential density is 0.03 kg m–3denser than at 10 m. No overlay indicates regions with high model agreement, where ≥80% of models agree on the sign of change. Diagonal lines indicate regions with low model agreement, where <80% of models agree on the sign of change (see Cross-Chapter Box Atlas.1 for more information). Further details on data sources and processing are available in the chapter data table (Table 9.SM.9).