Back chapter figures
Figure 9.6
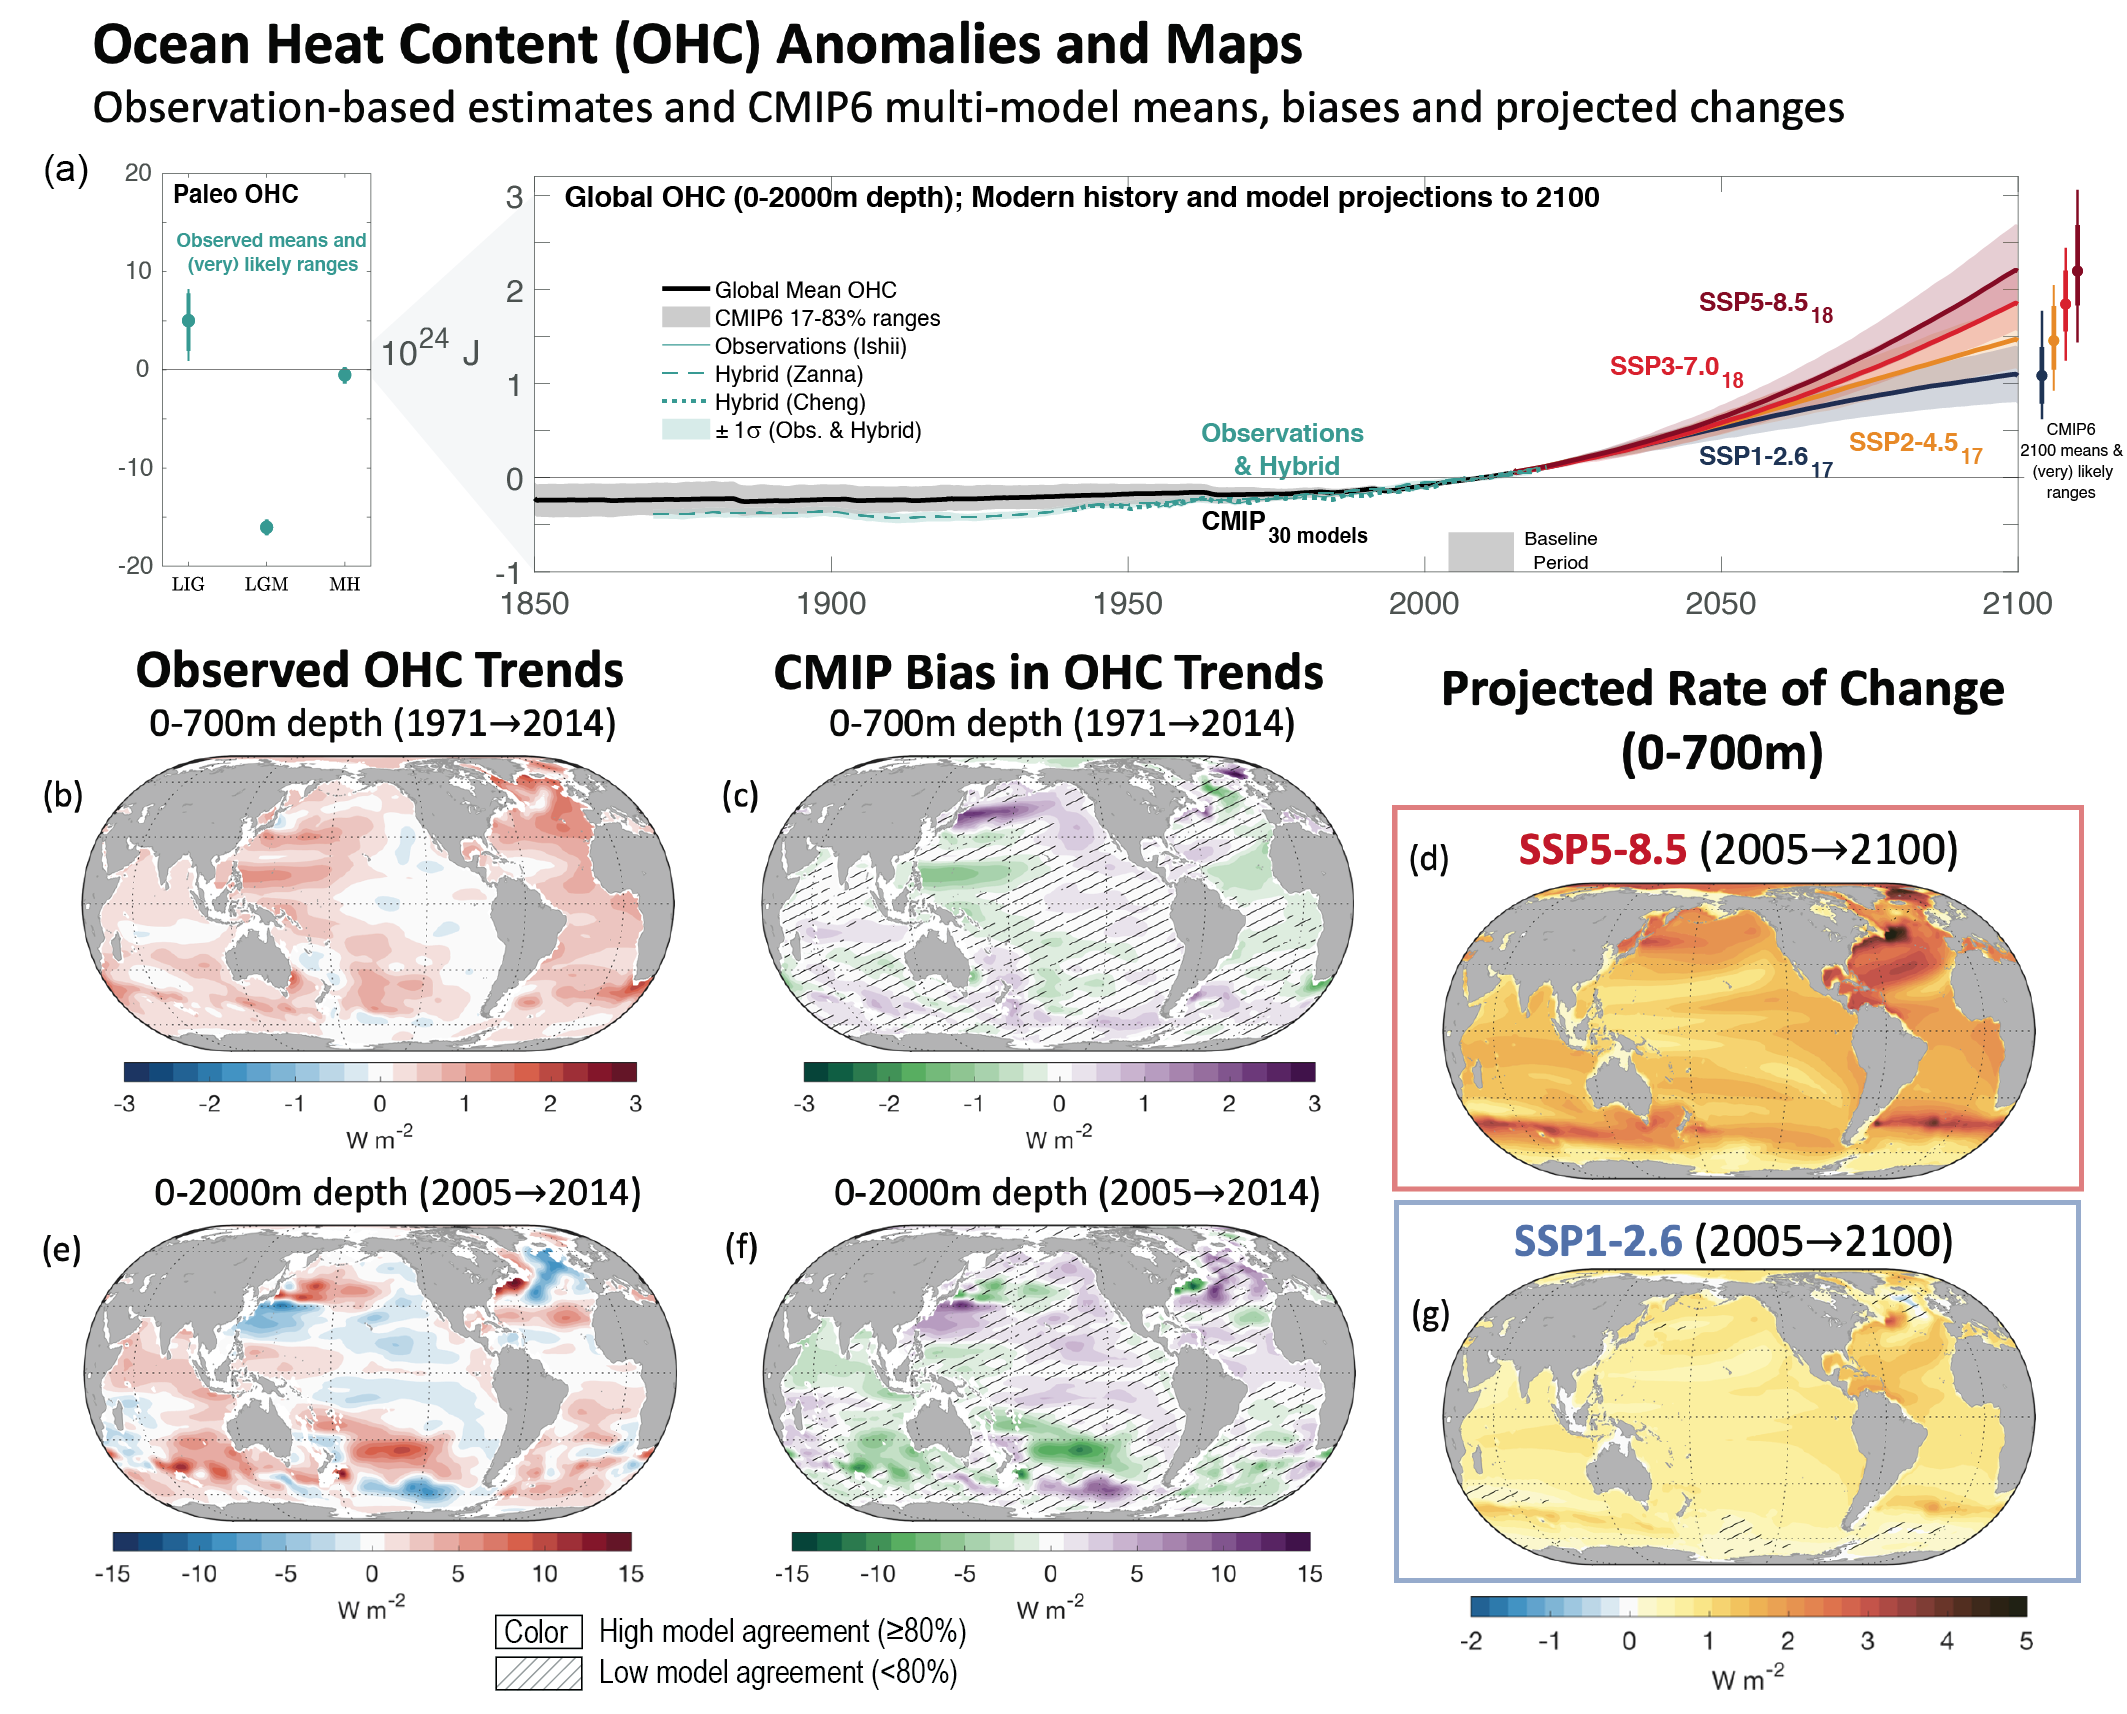
Figure caption
Figure 9.6 | Ocean heat content (OHC) and its changes with time. (a) Time series of global OHC anomaly relative to a 2005–2014 climatology in the upper 2000 m of the ocean. Shown are observations (Ishii et al., 2017; Baggenstos et al., 2019; Shackleton et al., 2020), model-observation hybrids (Cheng et al., 2019; Zanna et al., 2019), and multi-model means from the Coupled Model Intercomparison Project Phase 6 (CMIP6) historical (29 models) and Shared Socio-economic Pathway (SSP) scenarios (label subscripts indicate number of models per SSP). (b–g) Maps of OHC across different time periods, in different layers, and from different datasets/experiments. Maps show the CMIP6 ensemble bias and observed (Ishii et al., 2017) trends of OHC for (b, c) 0–700 m for the period 1971–2014, and (e, f) 0–2000 m for the period 2005–2017. CMIP6 ensemble mean maps show projected rate of change 2015–2100 for (d) SSP5-8.5 and (g) SSP1-2.6 scenarios. Also shown are the projected change in 0–700 m OHC for (d) SSP1-2.6 and (g) SSP5-8.5 in the CMIP6 ensembles, for the period 2091–2100 versus 2005–2014. No overlay indicates regions with high model agreement, where ≥80% of models agree on the sign of change. Diagonal lines indicate regions with low model agreement, where <80% of models agree on the sign of change (see Cross-Chapter Box Atlas.1 for more information). Further details on data sources and processing are available in the chapter data table (Table 9.SM.9).