Back chapter figures
Figure 9.8
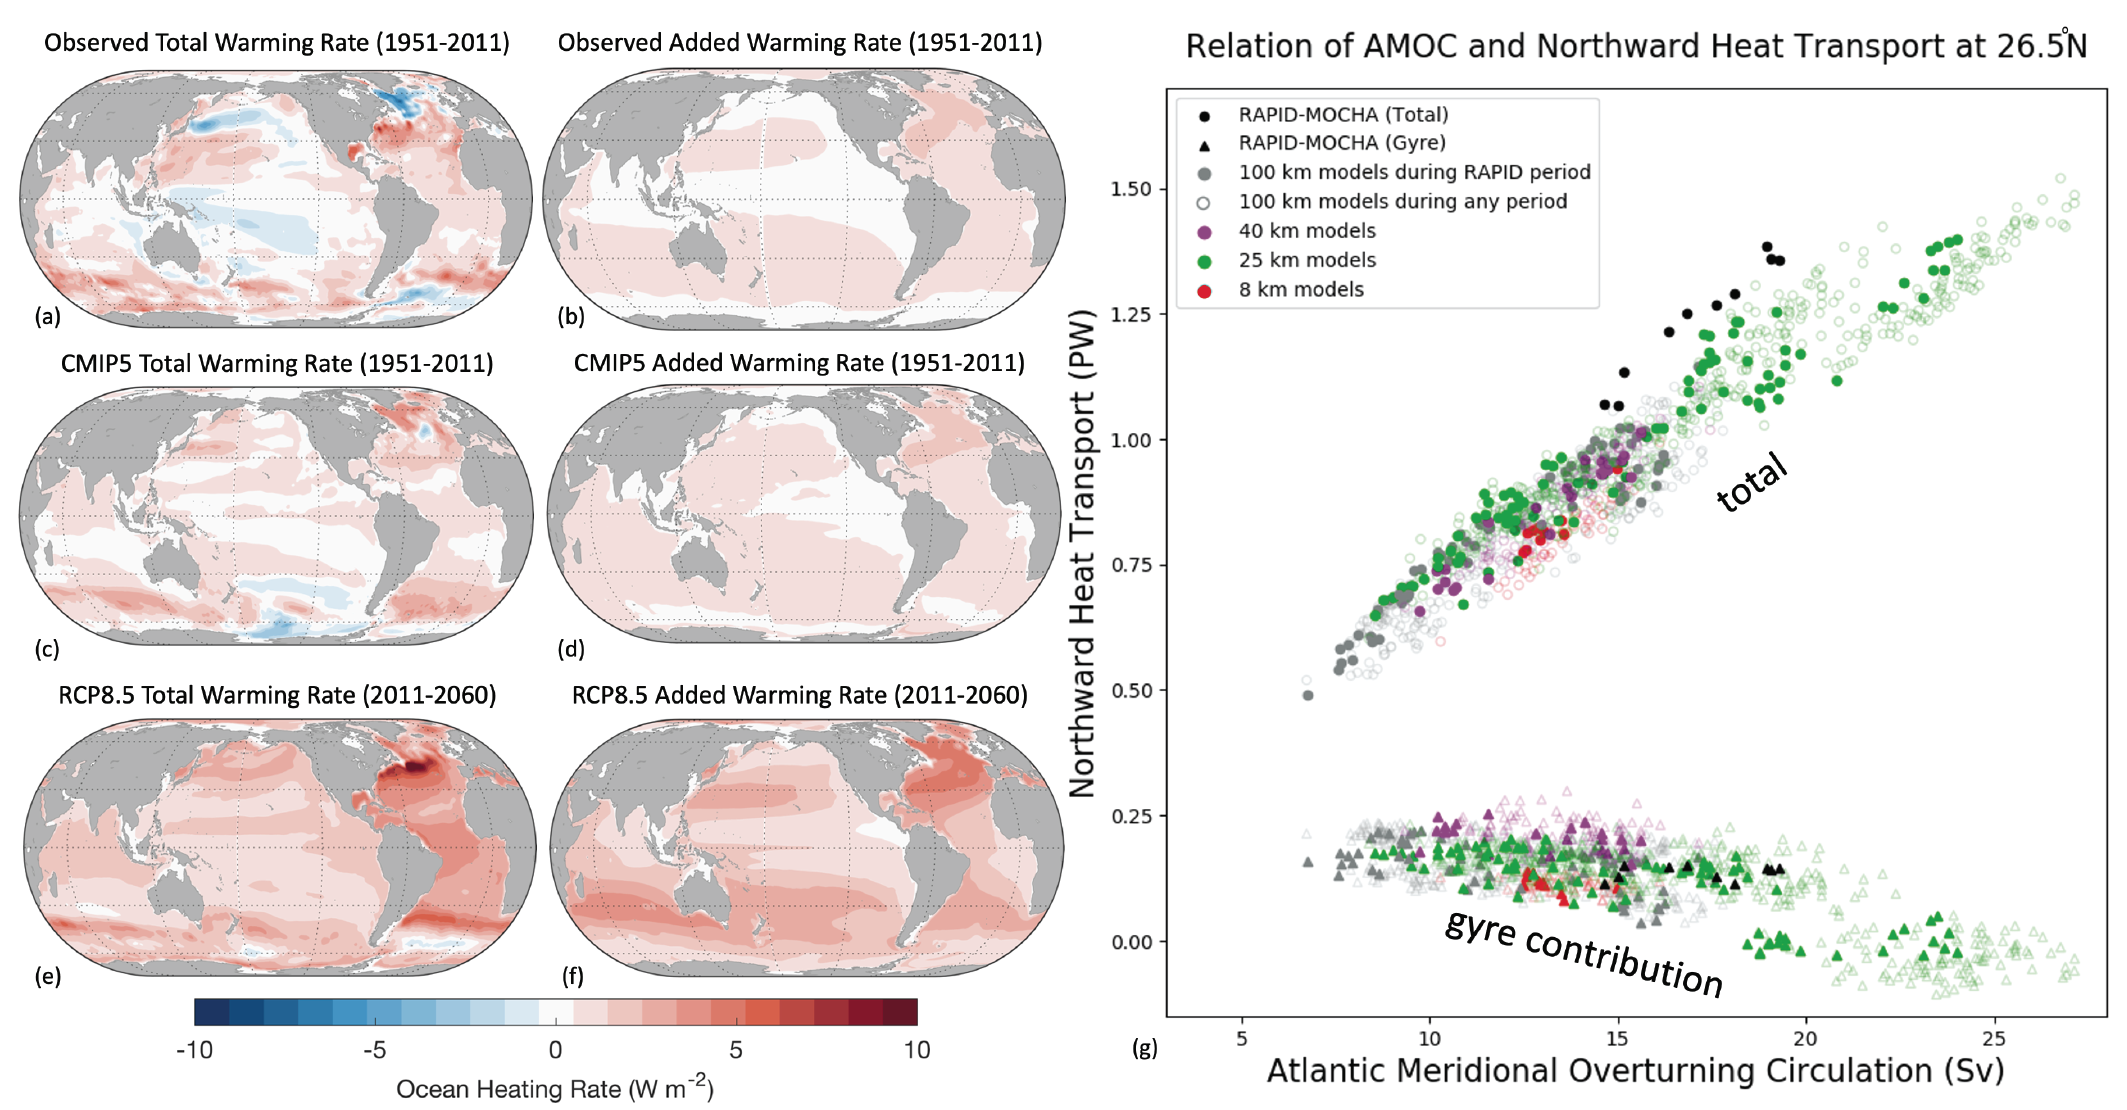
Figure caption
Figure 9.8 | Decomposition of simulated ocean heat content and northward ocean heat transport. (a, c, e) Total ocean heat content (0–2000 m) warming rate as observed and simulated by Coupled Model Intercomparison Project Phase 5 (CMIP5) models over the historical period (1972–2011) and under the RCP8.5 future (2021–2060) versus the associated decomposed (b, d, f) added heat contribution (neglecting changes in ocean circulation) to the total(Bronselaer and Zanna, 2020). (g) Relationship between northward heat transport and Atlantic Meridional Overturning Circulation (AMOC) in HighResMIP models (1950–2050) and observations during the RAPID period (2004–2018). Further details on data sources and processing are available in the chapter data table (Table 9.SM.9).