Back chapter figures
Figure 9.9
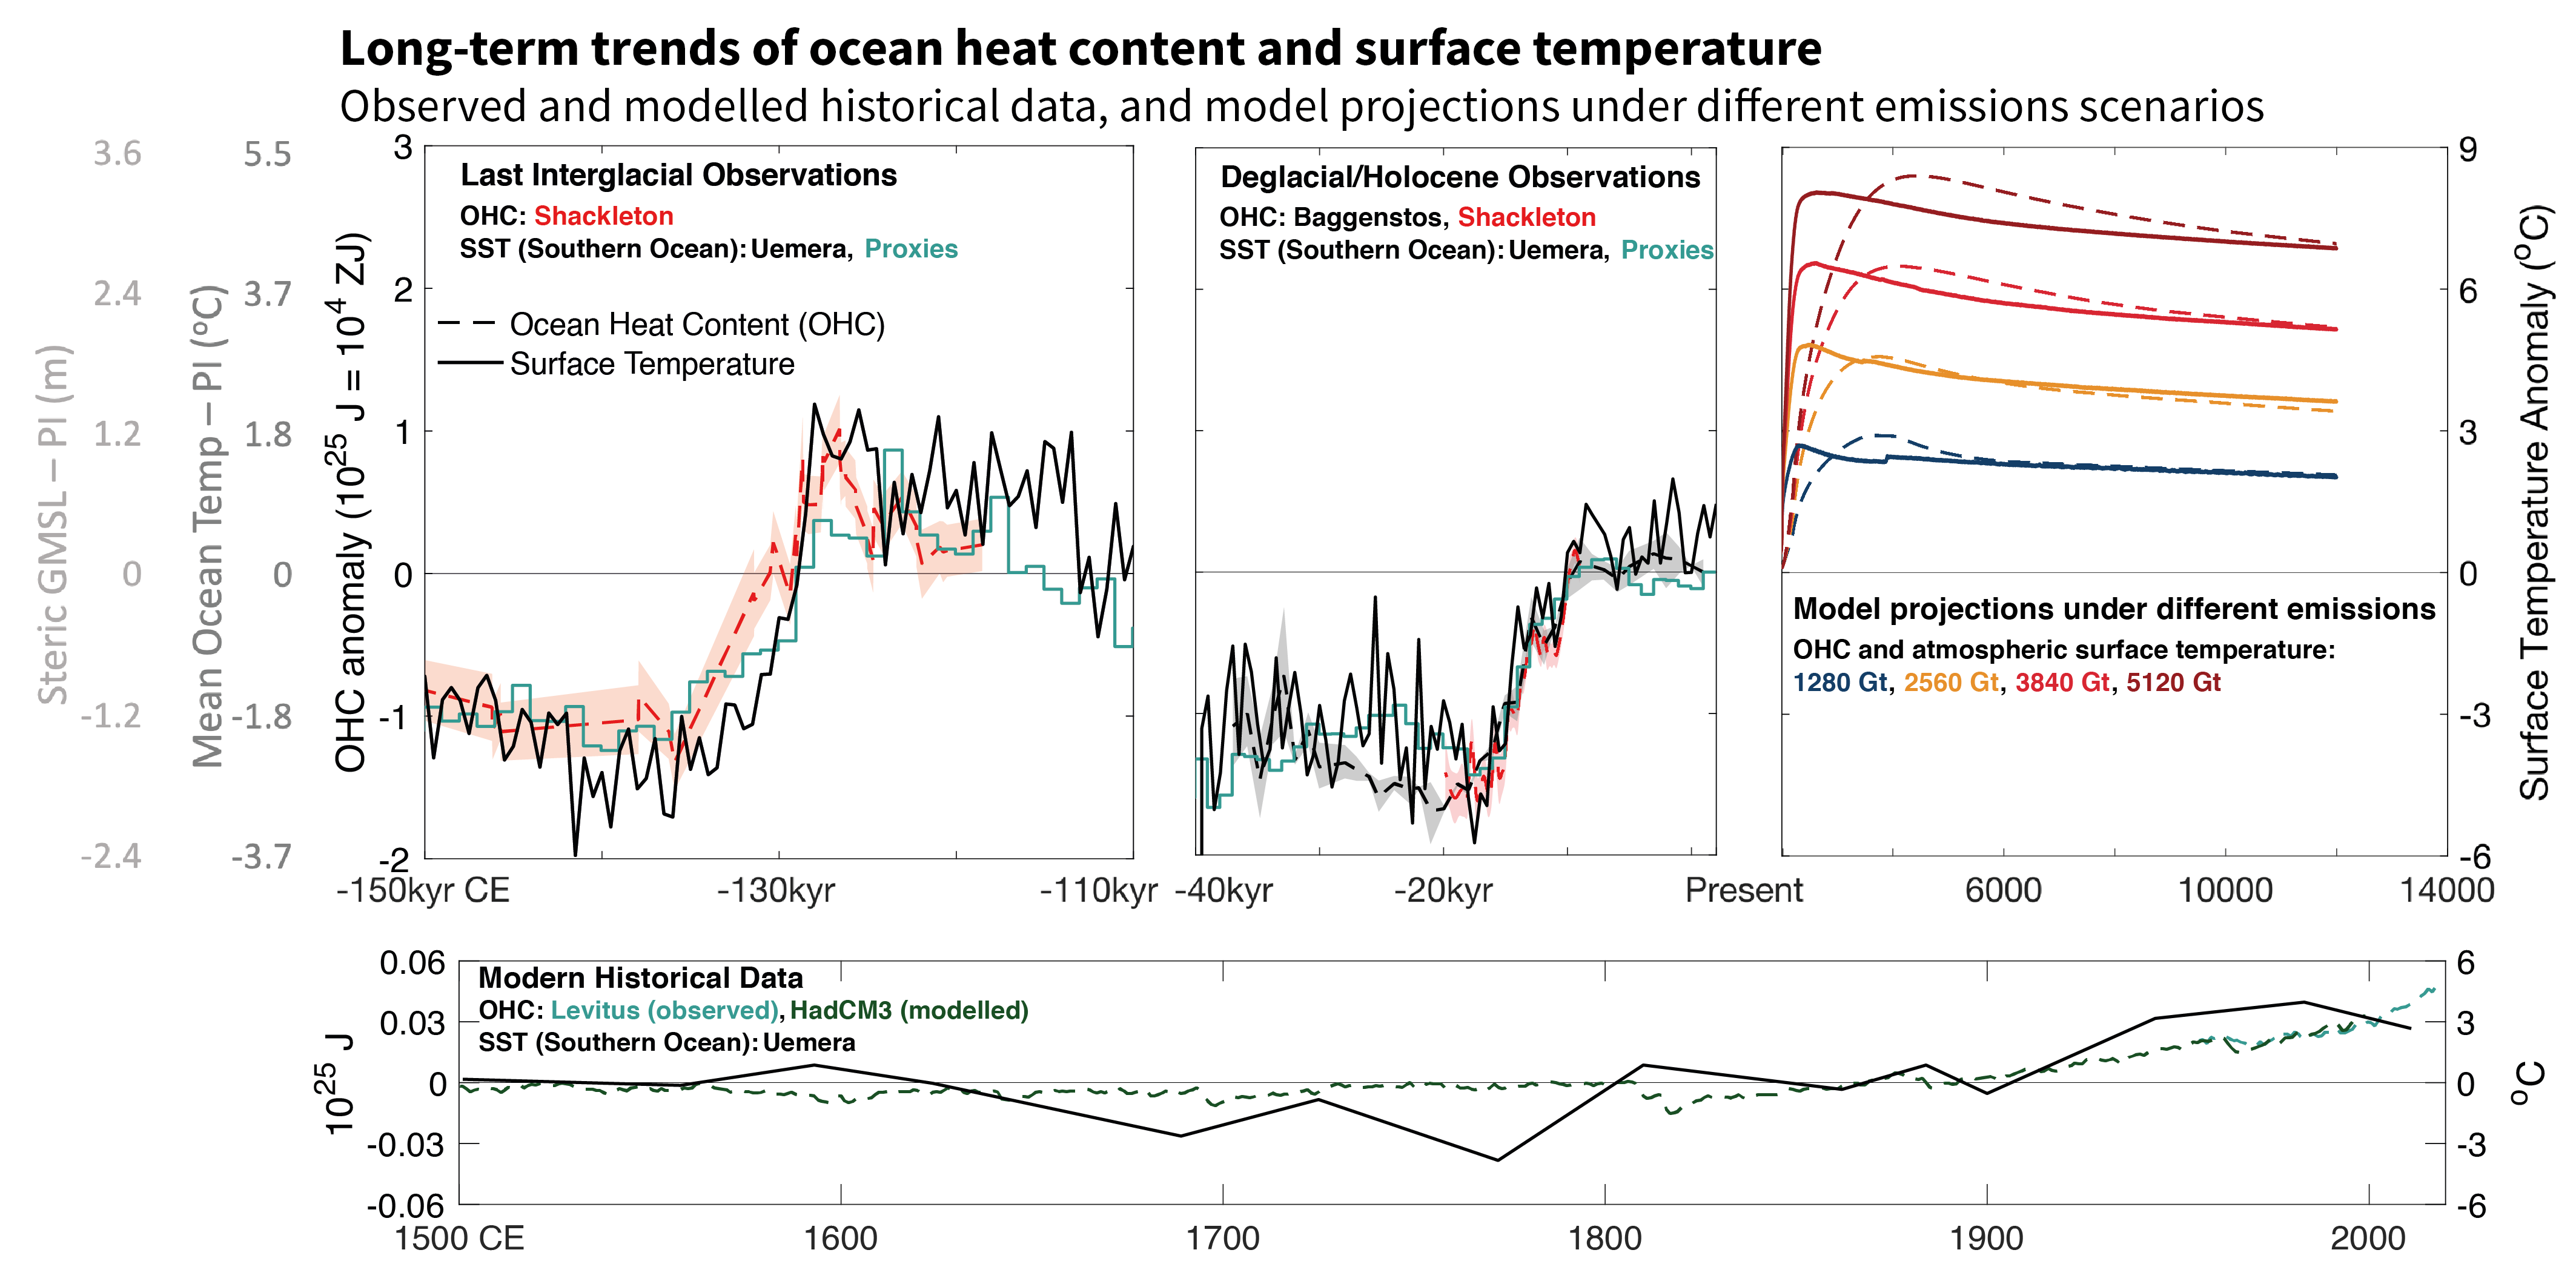
Figure caption
Figure 9.9 | Long-term trends of ocean heat content (OHC) and surface temperature. (a, b) Ice-core rare gas estimates of past mean OHC (ZJ), scaled to global mean ocean temperature (°C), and to steric global mean sea level (GMSL) (m) per CCB-2 (red dashed line), compared to surface temperatures (black solid line, gold solid line; °C rightmost axis). Southern Ocean sea surface temperature (SST) from multiple proxies in 11 sediment cores and from ice core deuterium excess (Uemura et al., 2018). (a) Penultimate glacial interval to last interglacial, 150,000–100,000 yr B2K (before 2000) (Shackleton et al., 2020). (b) Last glacial interval to modern interglacial, 40,000–0 yr B2K (Baggenstos et al., 2019; Shackleton et al., 2019). Changes in OHC (dashed lines) track changes in Southern Ocean SST (solid lines). (c) Long-term projected (2000 to 12000 CE) changes of OHC (dashed lines) in response to four greenhouse gas emissions scenarios (Clark et al., 2016) scale similarly to large-scale paleo changes but lag projected global mean SST (solid lines). (d) model simulated 1500–1999 OHC (Gregory et al., 2006) and 1955–2019 observations (Levitus et al., 2012) updated by NOAA NODC. All data expressed as anomalies relative to pre-industrial time. Further details on data sources and processing are available in the chapter data table (Table 9.SM.9).