Figure SPM.1
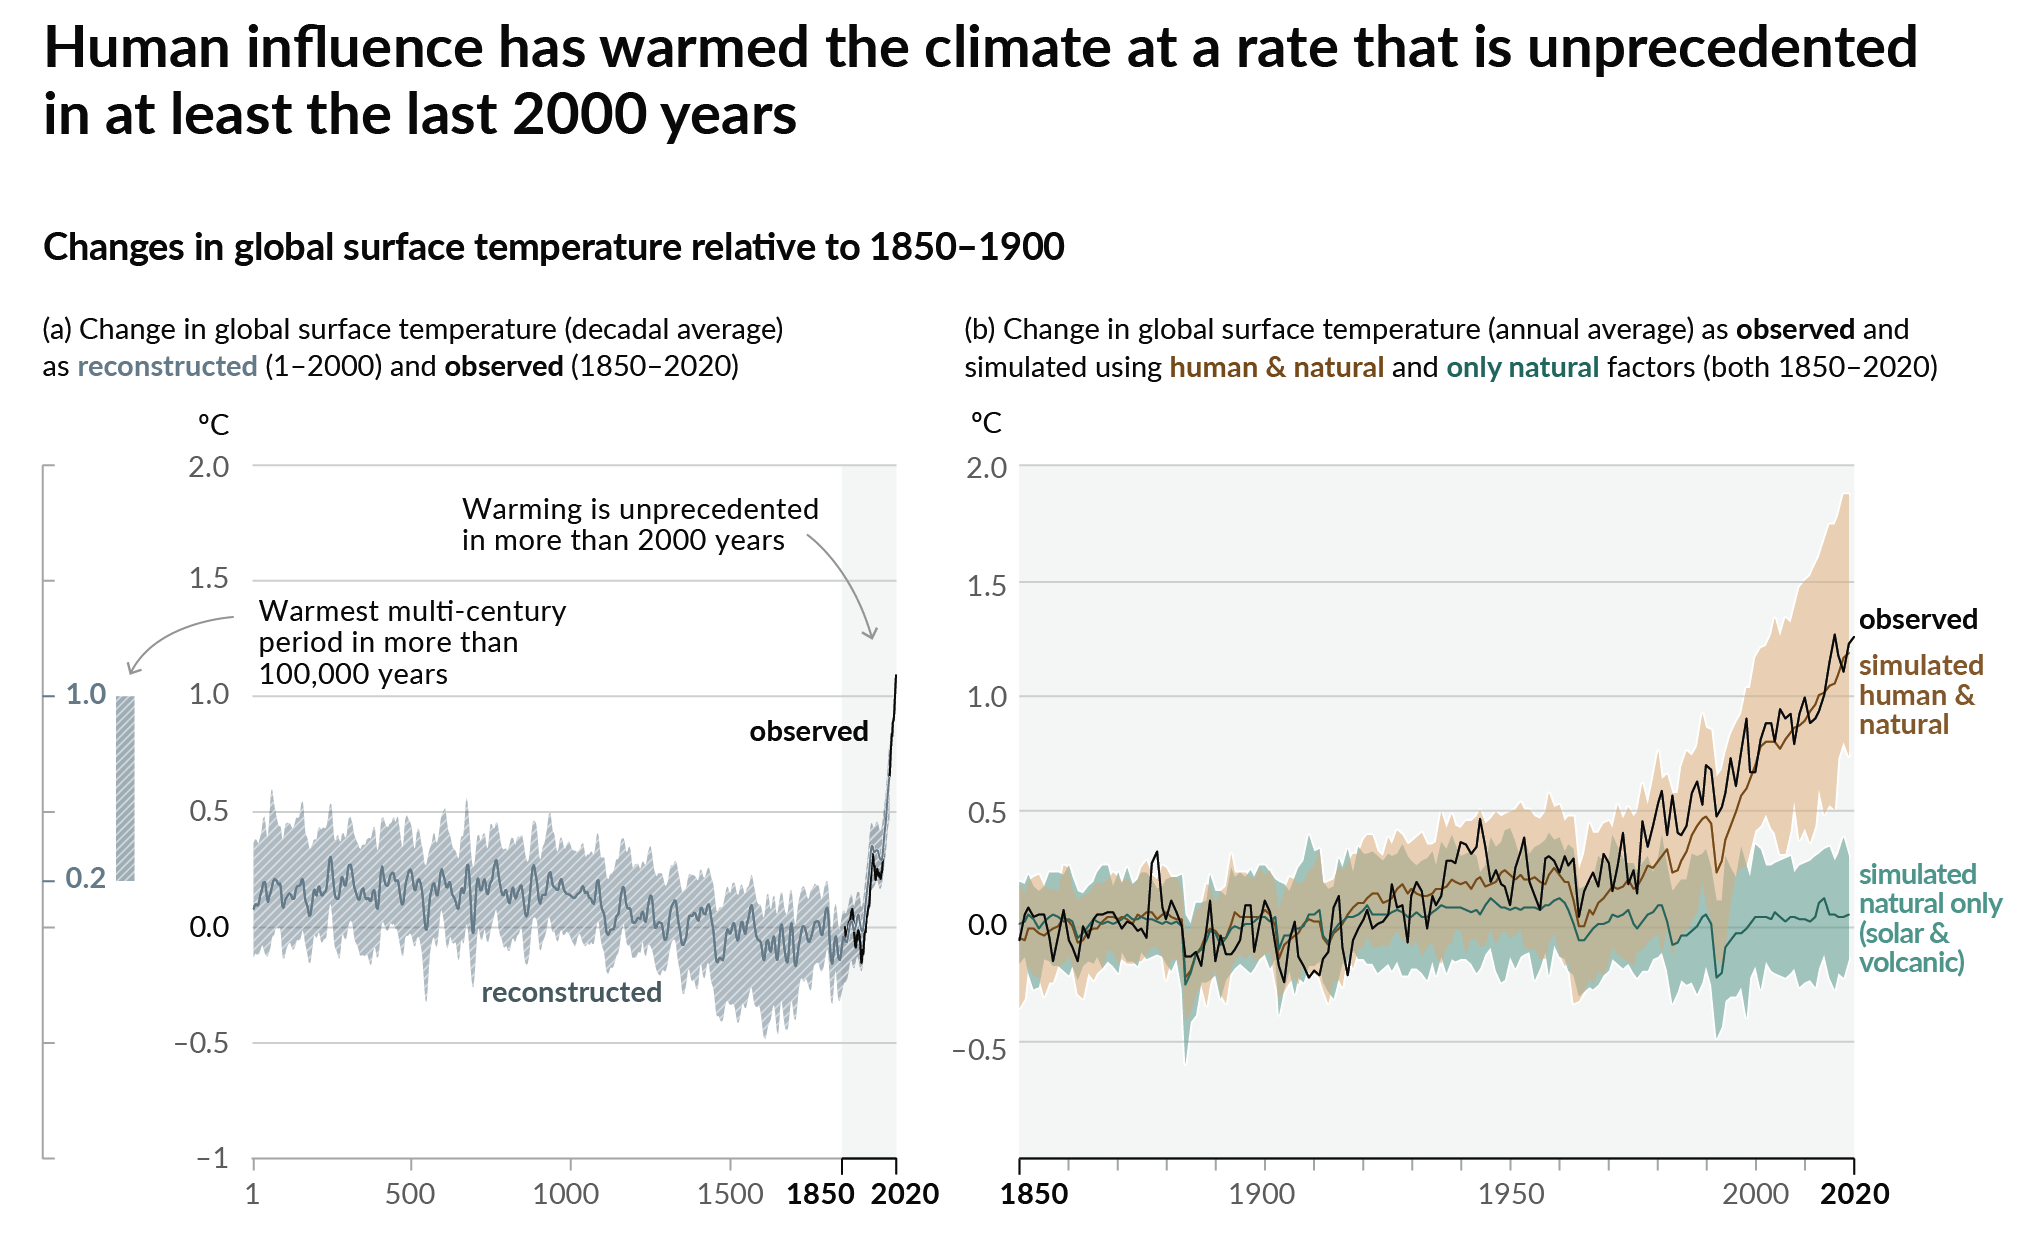
Figure caption
Figure SPM.1 | History of global temperature change and causes of recent warming
Panel (a) Changes in global surface temperature reconstructed from paleoclimate archives (solid grey line, years 1–2000) and from direct observations(solid black line, 1850–2020), both relative to 1850–1900 and decadally averaged. The vertical bar on the left shows the estimated temperature (very likely range) during the warmest multi-century period in at least the last 100,000 years, which occurred around 6500 years ago during the current interglacial period (Holocene). The Last Interglacial, around 125,000 years ago, is the next most recent candidate for a period of higher temperature. These past warm periods were caused by slow (multi-millennial) orbital variations. The grey shading with white diagonal lines shows the very likely ranges for the temperature reconstructions.
Panel (b) Changes in global surface temperature over the past 170 years (black line) relative to 1850–1900 and annually averaged, compared to Coupled Model Intercomparison Project Phase 6 (CMIP6) climate model simulations (see Box SPM.1) of the temperature response to both human and natural drivers (brown) and to only natural drivers (solar and volcanic activity, green). Solid coloured lines show the multi-model average, and coloured shades show the very likely range of simulations. (See Figure SPM.2 for the assessed contributions to warming). {2.3.1, Cross-Chapter Box 2.3, 3.3, TS.2.2, Cross-Section Box TS.1, Figure 1a}