Figure SPM.10
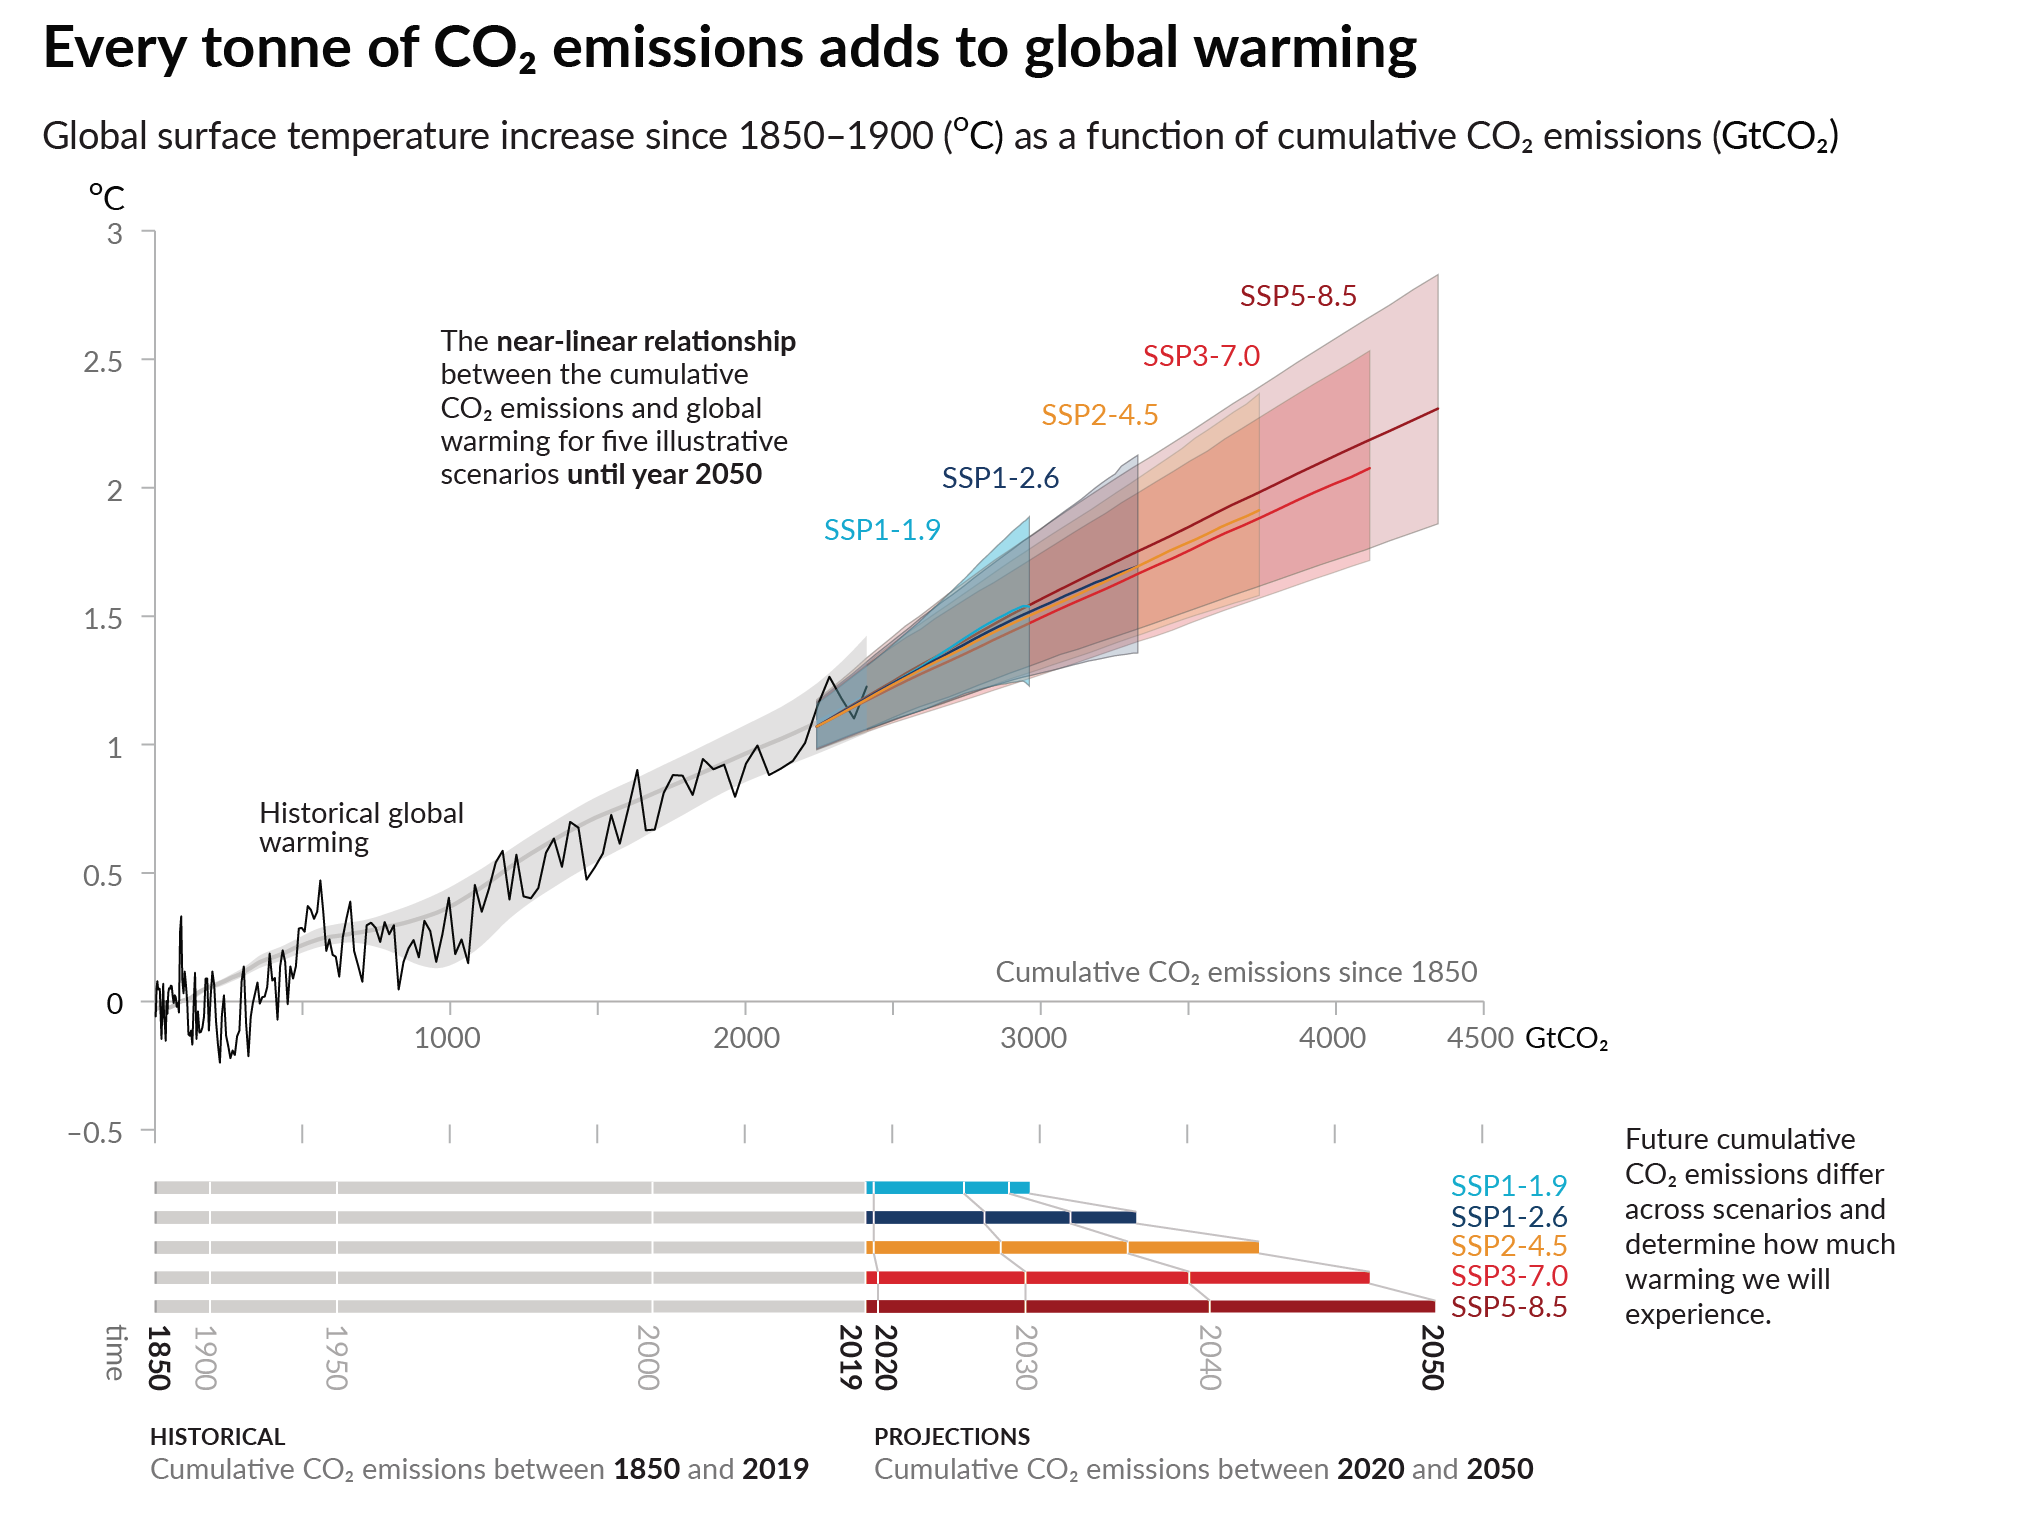
Figure caption
Top panel: Historical data (thin black line) shows observed global surface temperature increase in °C since 1850–1900 as a function of historical cumulative carbon dioxide (CO2) emissions in GtCO2 from 1850 to 2019. The grey range with its central line shows a corresponding estimate of the historical human-caused surface warming (see Figure SPM.2). Coloured areas show the assessed very likely range of global surface temperature projections, and thick coloured central lines show the median estimate as a function of cumulative CO2 emissions from 2020 until year 2050 for the set of illustrative scenarios (SSP1-1.9, SSP1-2.6, SSP2-4.5, SSP3-7.0, and SSP5-8.5; see Figure SPM.4). Projections use the cumulative CO2 emissions of each respective scenario, and the projected global warming includes the contribution from all anthropogenic forcers. The relationship is illustrated over the domain of cumulative CO2 emissions for which there is high confidence that the transient climate response to cumulative CO2 emissions (TCRE) remains constant, and for the time period from 1850 to 2050 over which global CO2 emissions remain net positive under all illustrative scenarios, as there is limited evidence supporting the quantitative application of TCRE to estimate temperature evolution under net negative CO2 emissions.
Bottom panel: Historical and projected cumulative CO2 emissions in GtCO2 for the respective scenarios. {Section 5.5, Figure 5.31, Figure TS.18}