Figure SPM.2
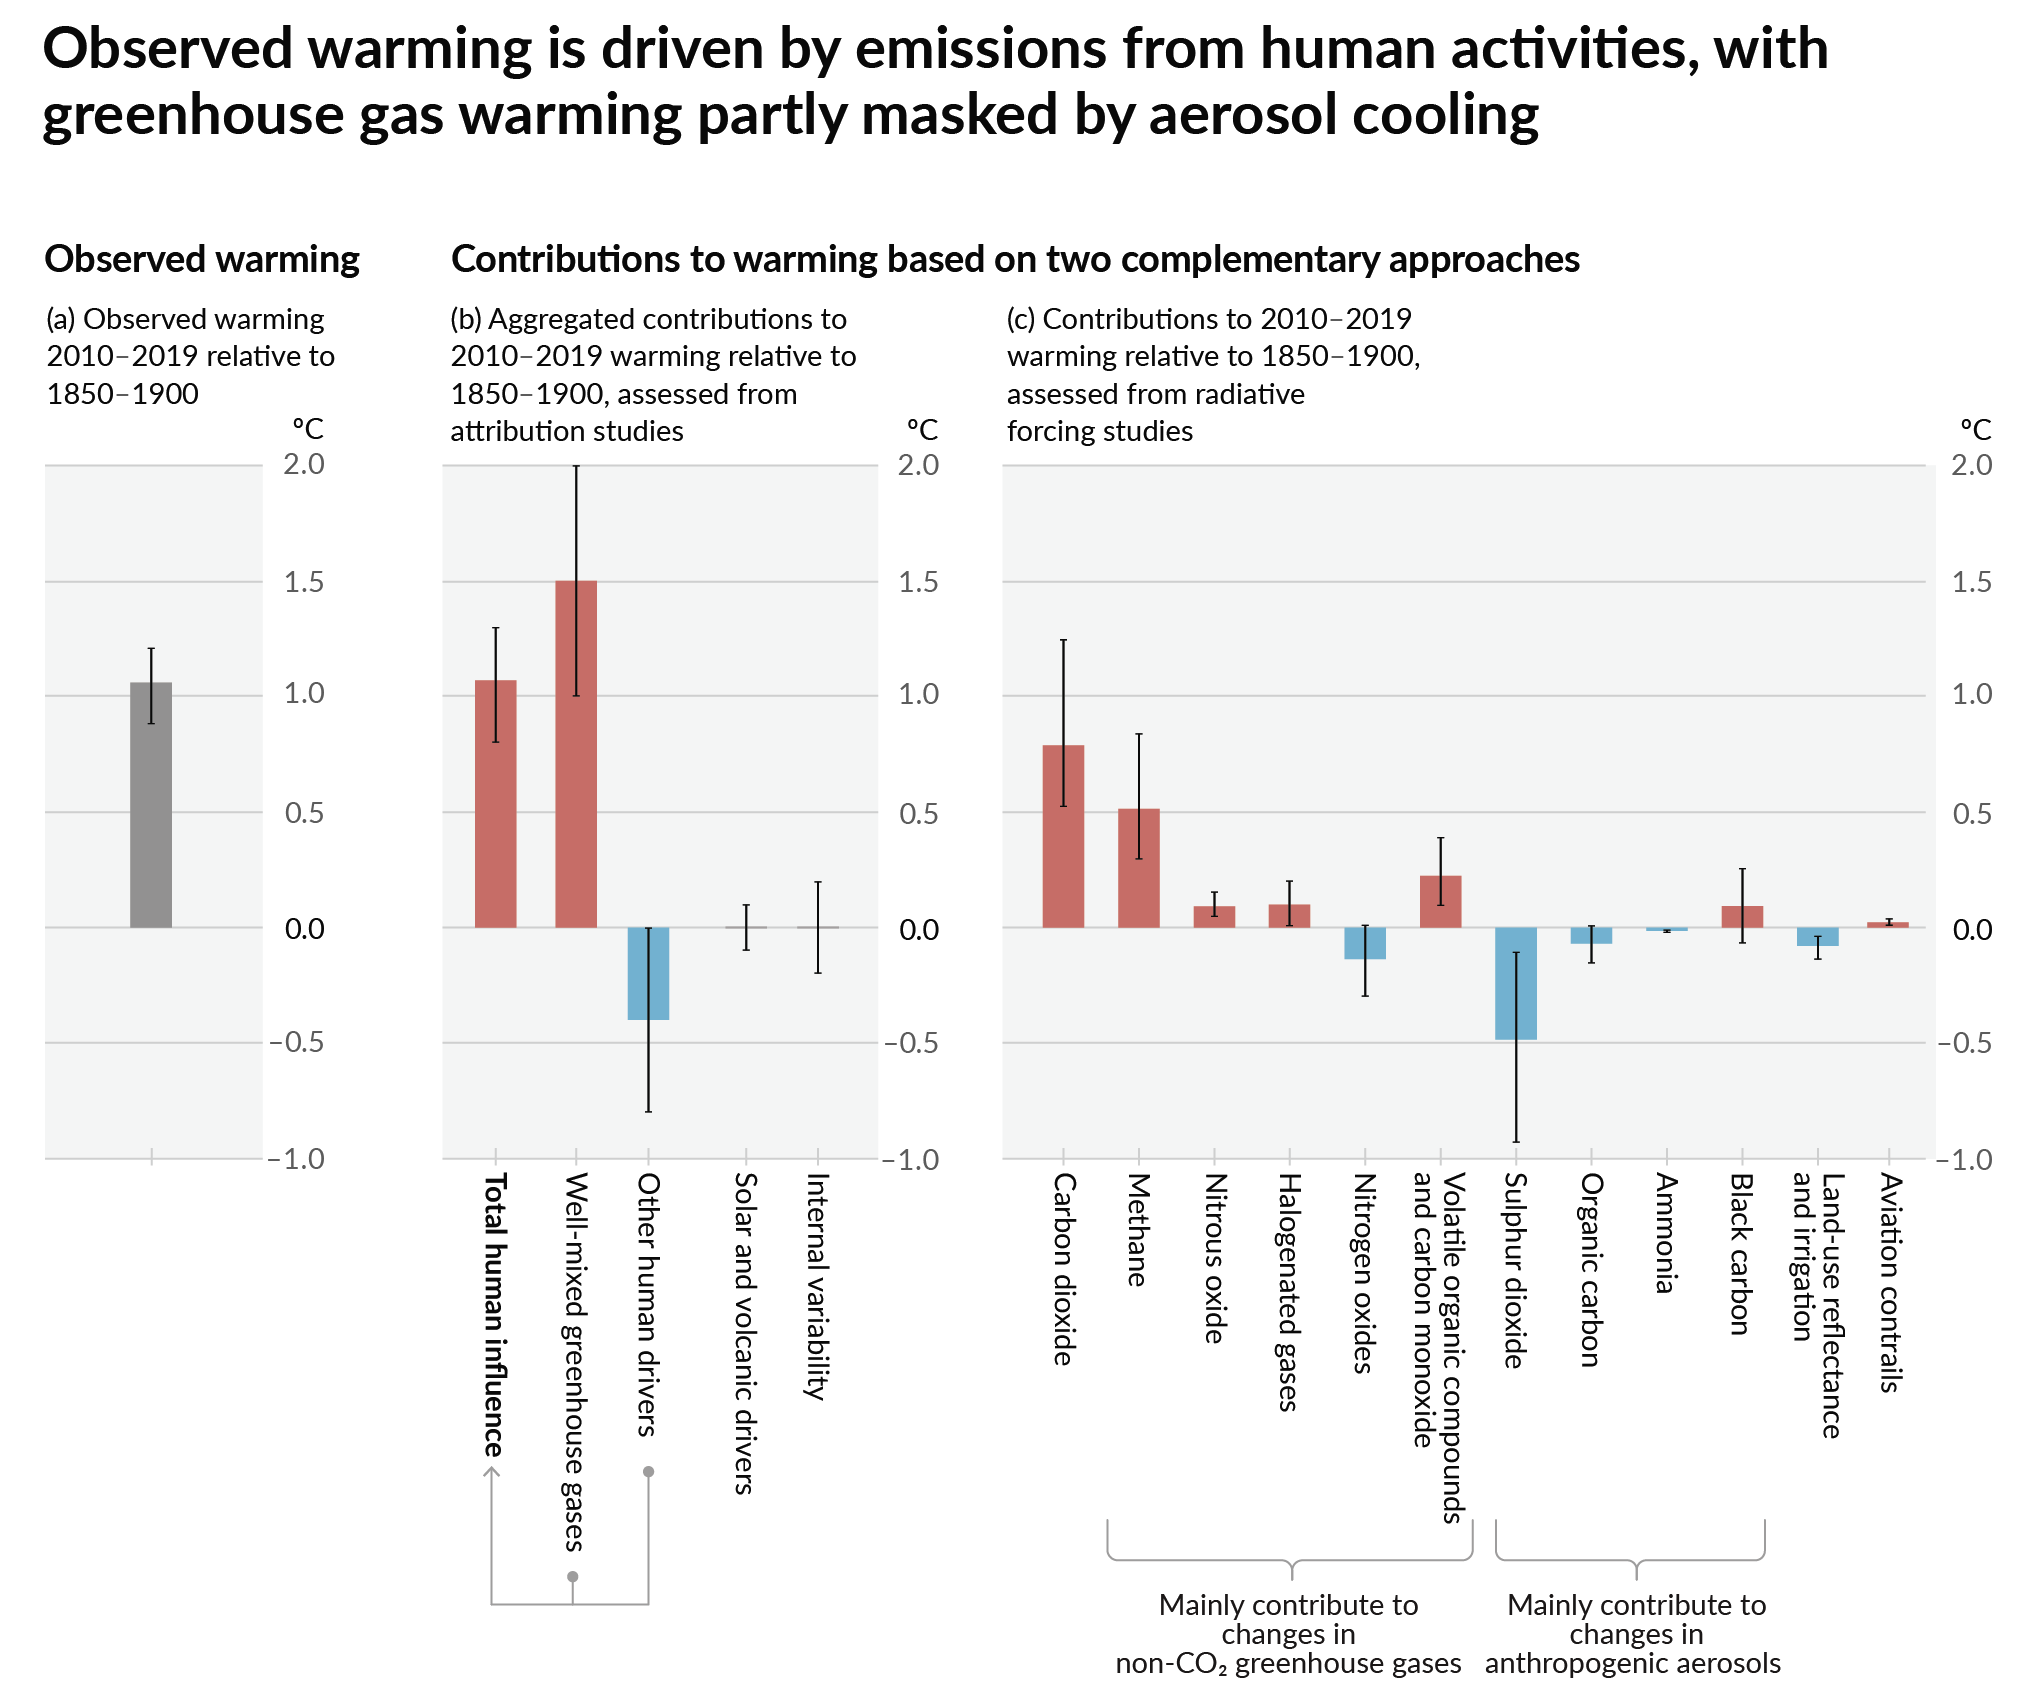
Figure caption
Figure SPM.2 | Assessed contributions to observed warming in 2010–2019 relative to 1850–1900
Panel (a) Observed global warming (increase in global surface temperature). Whiskers show the very likely range.
Panel (b) Evidence from attribution studies, which synthesize information from climate models and observations. The panel shows temperature change attributed to: total human influence; changes in well-mixed greenhouse gas concentrations; other human drivers due to aerosols, ozone and land-use change (land-use reflectance); solar and volcanic drivers; and internal climate variability. Whiskers showlikely ranges.
Panel (c) Evidence from the assessment of radiative forcing and climate sensitivity. The panel shows temperature changes from individual components of human influence: emissions of greenhouse gases, aerosols and their precursors; land-use changes (land-use reflectance and irrigation); and aviation contrails. Whiskers showvery likely ranges. Estimates account for both direct emissions into the atmosphere and their effect, if any, on other climate drivers. For aerosols, both direct effects (through radiation) and indirect effects (through interactions with clouds) are considered. {Cross-Chapter Box 2.3, 3.3.1, 6.4.2, 7.3}