Figure SPM.3
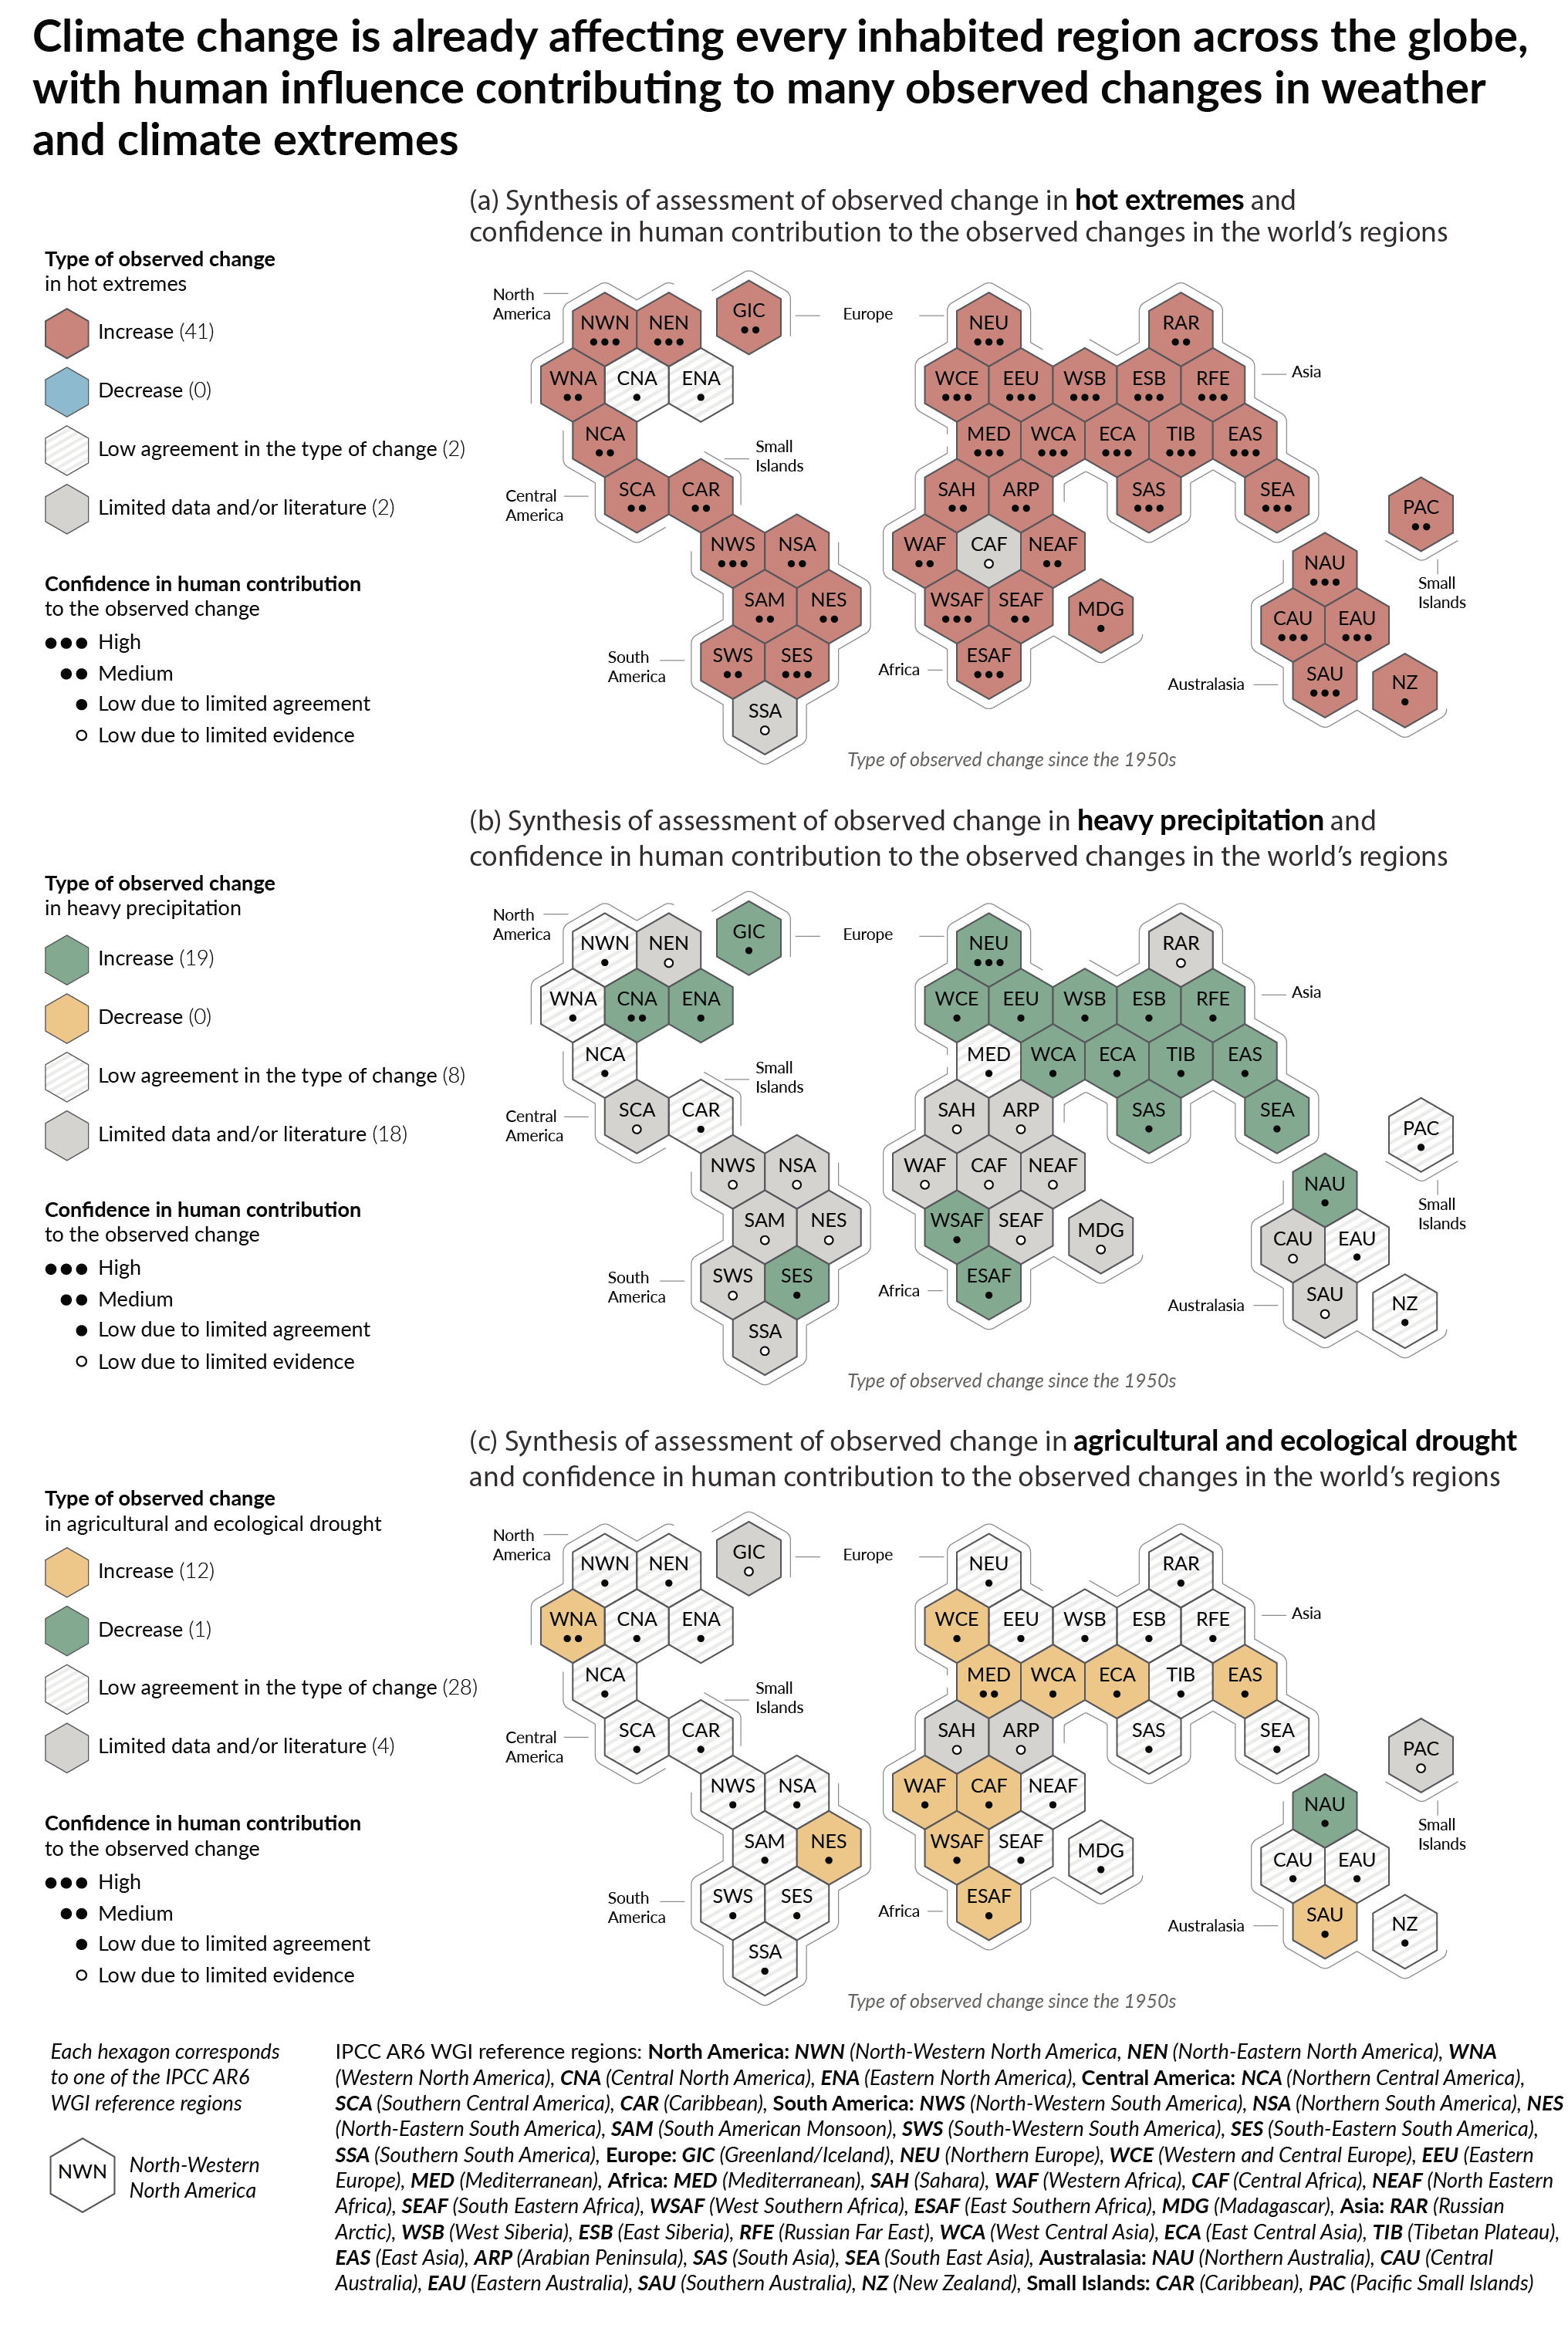
Figure caption
The IPCC AR6 WGI inhabited regions are displayed as hexagons with identical size in their approximate geographical location (see legend for regional acronyms). All assessments are made for each region as a whole and for the 1950s to the present. Assessments made on different time scales or more local spatial scales might differ from what is shown in the figure. The colours in each panel represent the four outcomes of the assessment on observed changes. Striped hexagons (white and light-grey) are used where there is low agreement in the type of change for the region as a whole, and grey hexagons are used when there is limited data and/or literature that prevents an assessment of the region as a whole. Other colours indicate at least medium confidence in the observed change. The confidence level for the human influence on these observed changes is based on assessing trend detection and attribution and event attribution literature, and it is indicated by the number of dots: three dots for high confidence, two dots formedium confidence and one dot forlow confidence (single, filled dot: limited agreement; single, empty dot: limited evidence).
Panel (a) For hot extremes, the evidence is mostly drawn from changes in metrics based on daily maximum temperatures; regional studies using other indices (heatwave duration, frequency and intensity) are used in addition. Red hexagons indicate regions where there is at least medium confidence in an observed increase in hot extremes.
Panel (b) For heavy precipitation, the evidence is mostly drawn from changes in indices based on one-day or five-day precipitation amounts using global and regional studies. Green hexagons indicate regions where there is at least medium confidence in an observed increase in heavy precipitation.
Panel (c) Agricultural and ecological droughts are assessed based on observed and simulated changes in total column soil moisture, complemented by evidence on changes in surface soil moisture, water balance (precipitation minus evapotranspiration) and indices driven by precipitation and atmospheric evaporative demand. Yellow hexagons indicate regions where there is at least medium confidence in an observed increase in this type of drought, and green hexagons indicate regions where there is at least medium confidence in an observed decrease in agricultural and ecological drought.
For all regions, Table TS.5 shows a broader range of observed changes besides the ones shown in this figure. Note that Southern South America (SSA) is the only region that does not display observed changes in the metrics shown in this figure, but is affected by observed increases in mean temperature, decreases in frost and increases in marine heatwaves. {11.9, Atlas 1.3.3, Figure Atlas.2, Table TS.5, Box TS.10, Figure 1}