Figure SPM.4
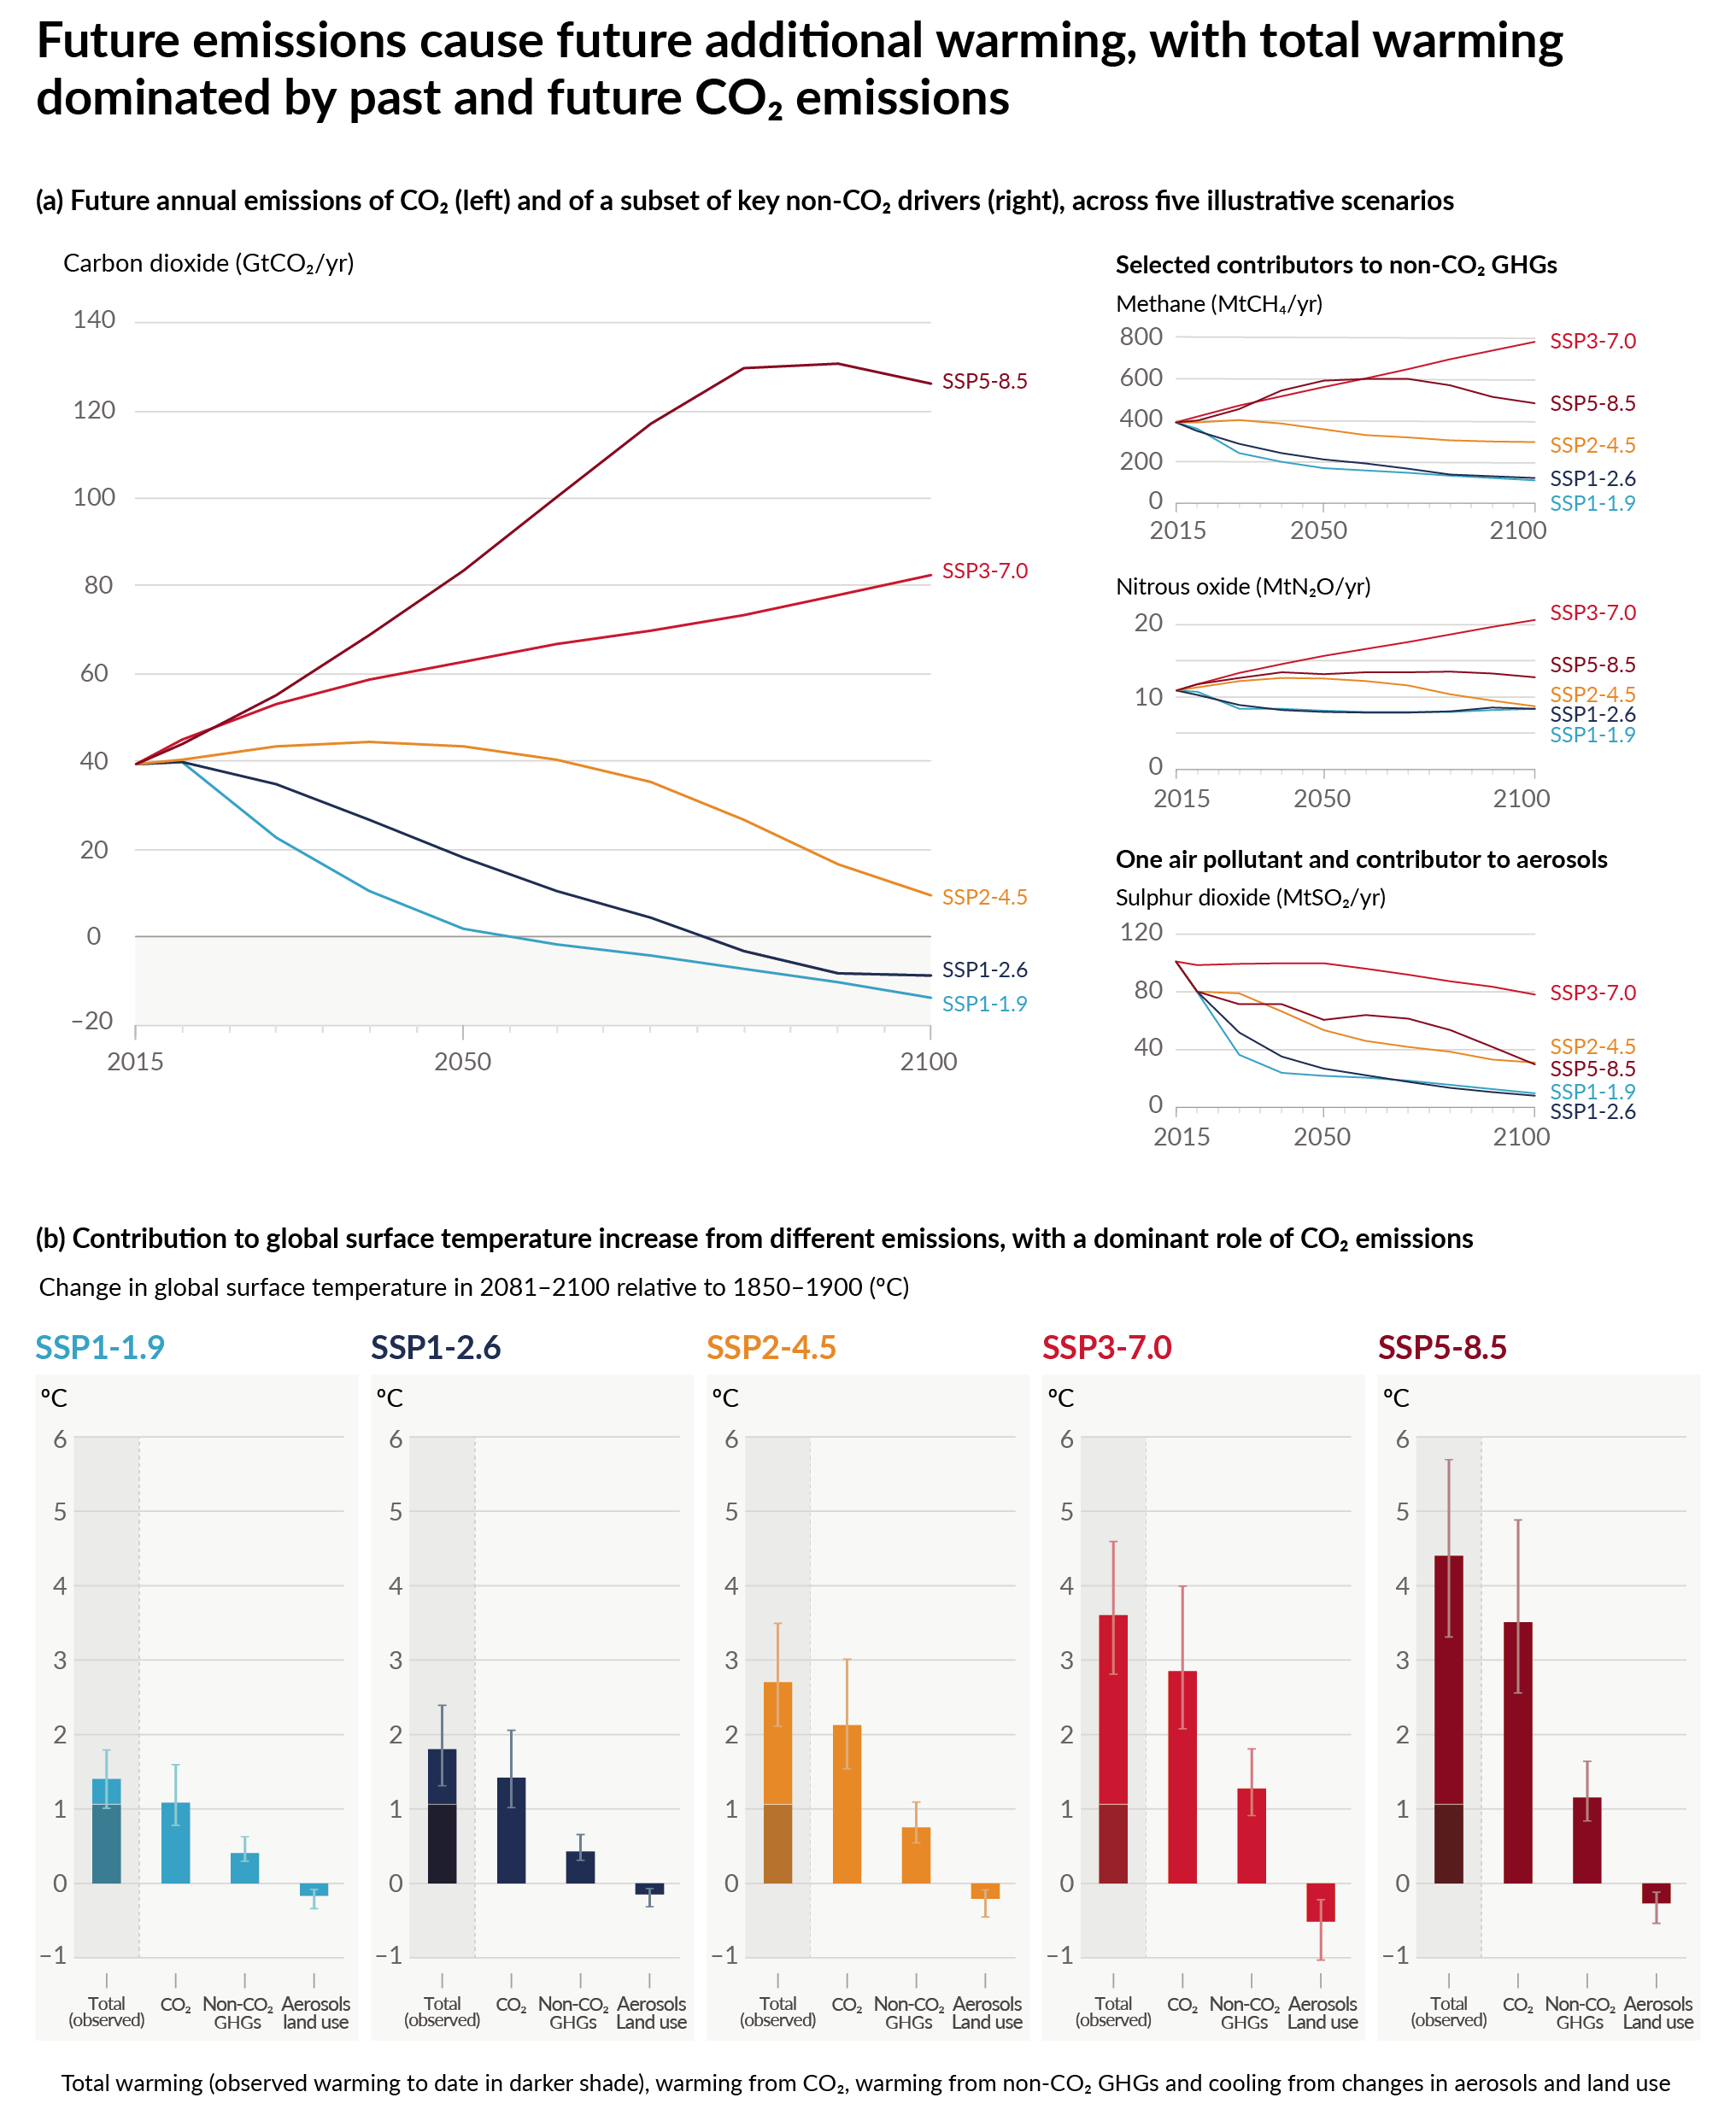
Figure caption
Figure SPM.4 | Future anthropogenic emissions of key drivers of climate change and warming contributions by groups of drivers for the five illustrative scenarios used in this report. The five scenarios are SSP1-1.9, SSP1-2.6, SSP2-4.5, SSP3-7.0 and SSP5-8.5.
Panel (a) Annual anthropogenic (human-caused) emissions over the 2015–2100 period. Shown are emissions trajectories for carbon dioxide (CO2) from all sectors (GtCO2 /yr) (left graph) and for a subset of three key non-CO2 drivers considered in the scenarios: methane (CH4, MtCH4/yr, top-right graph); nitrous oxide (N2O, MtN2O/yr, middle-right graph); and sulphur dioxide (SO2, MtSO2/yr, bottom-right graph, contributing to anthropogenic aerosols in panel (b).
Panel (b) Warming contributions by groups of anthropogenic drivers and by scenario are shown as the change in global surface temperature (°C) in 2081–2100 relative to 1850–1900, with indication of the observed warming to date. Bars and whiskers represent median values and the very likely range, respectively. Within each scenario bar plot, the bars represent: total global warming (°C; ‘total’bar) (see Table SPM.1); warming contributions (°C) from changes in CO2 (‘CO2 ’bar) and from non-CO2 greenhouse gases (GHGs; ‘non-CO2 GHGs’bar: comprising well-mixed greenhouse gases and ozone); and net cooling from other anthropogenic drivers (‘aerosols and land use’bar: anthropogenic aerosols, changes in reflectance due to land-use and irrigation changes, and contrails from aviation) (see Figure SPM.2, panel c, for the warming contributions to date for individual drivers). The best estimate for observed warming in 2010–2019 relative to 1850–1900 (see Figure SPM.2, panel a) is indicated in the darker column in the ‘total’ bar. Warming contributions in panel (b) are calculated as explained in Table SPM.1 for the total bar. For the other bars, the contribution by groups of drivers is calculated with a physical climate emulator of global surface temperature that relies on climate sensitivity and radiative forcing assessments. {Cross-Chapter Box 1.4, 4.6, Figure 4.35, 6.7, Figures 6.18, 6.22 and 6.24, 7.3, Cross-Chapter Box 7.1, Figure 7.7, Box TS.7, Figures TS.4 and TS.15}