Figure SPM.5
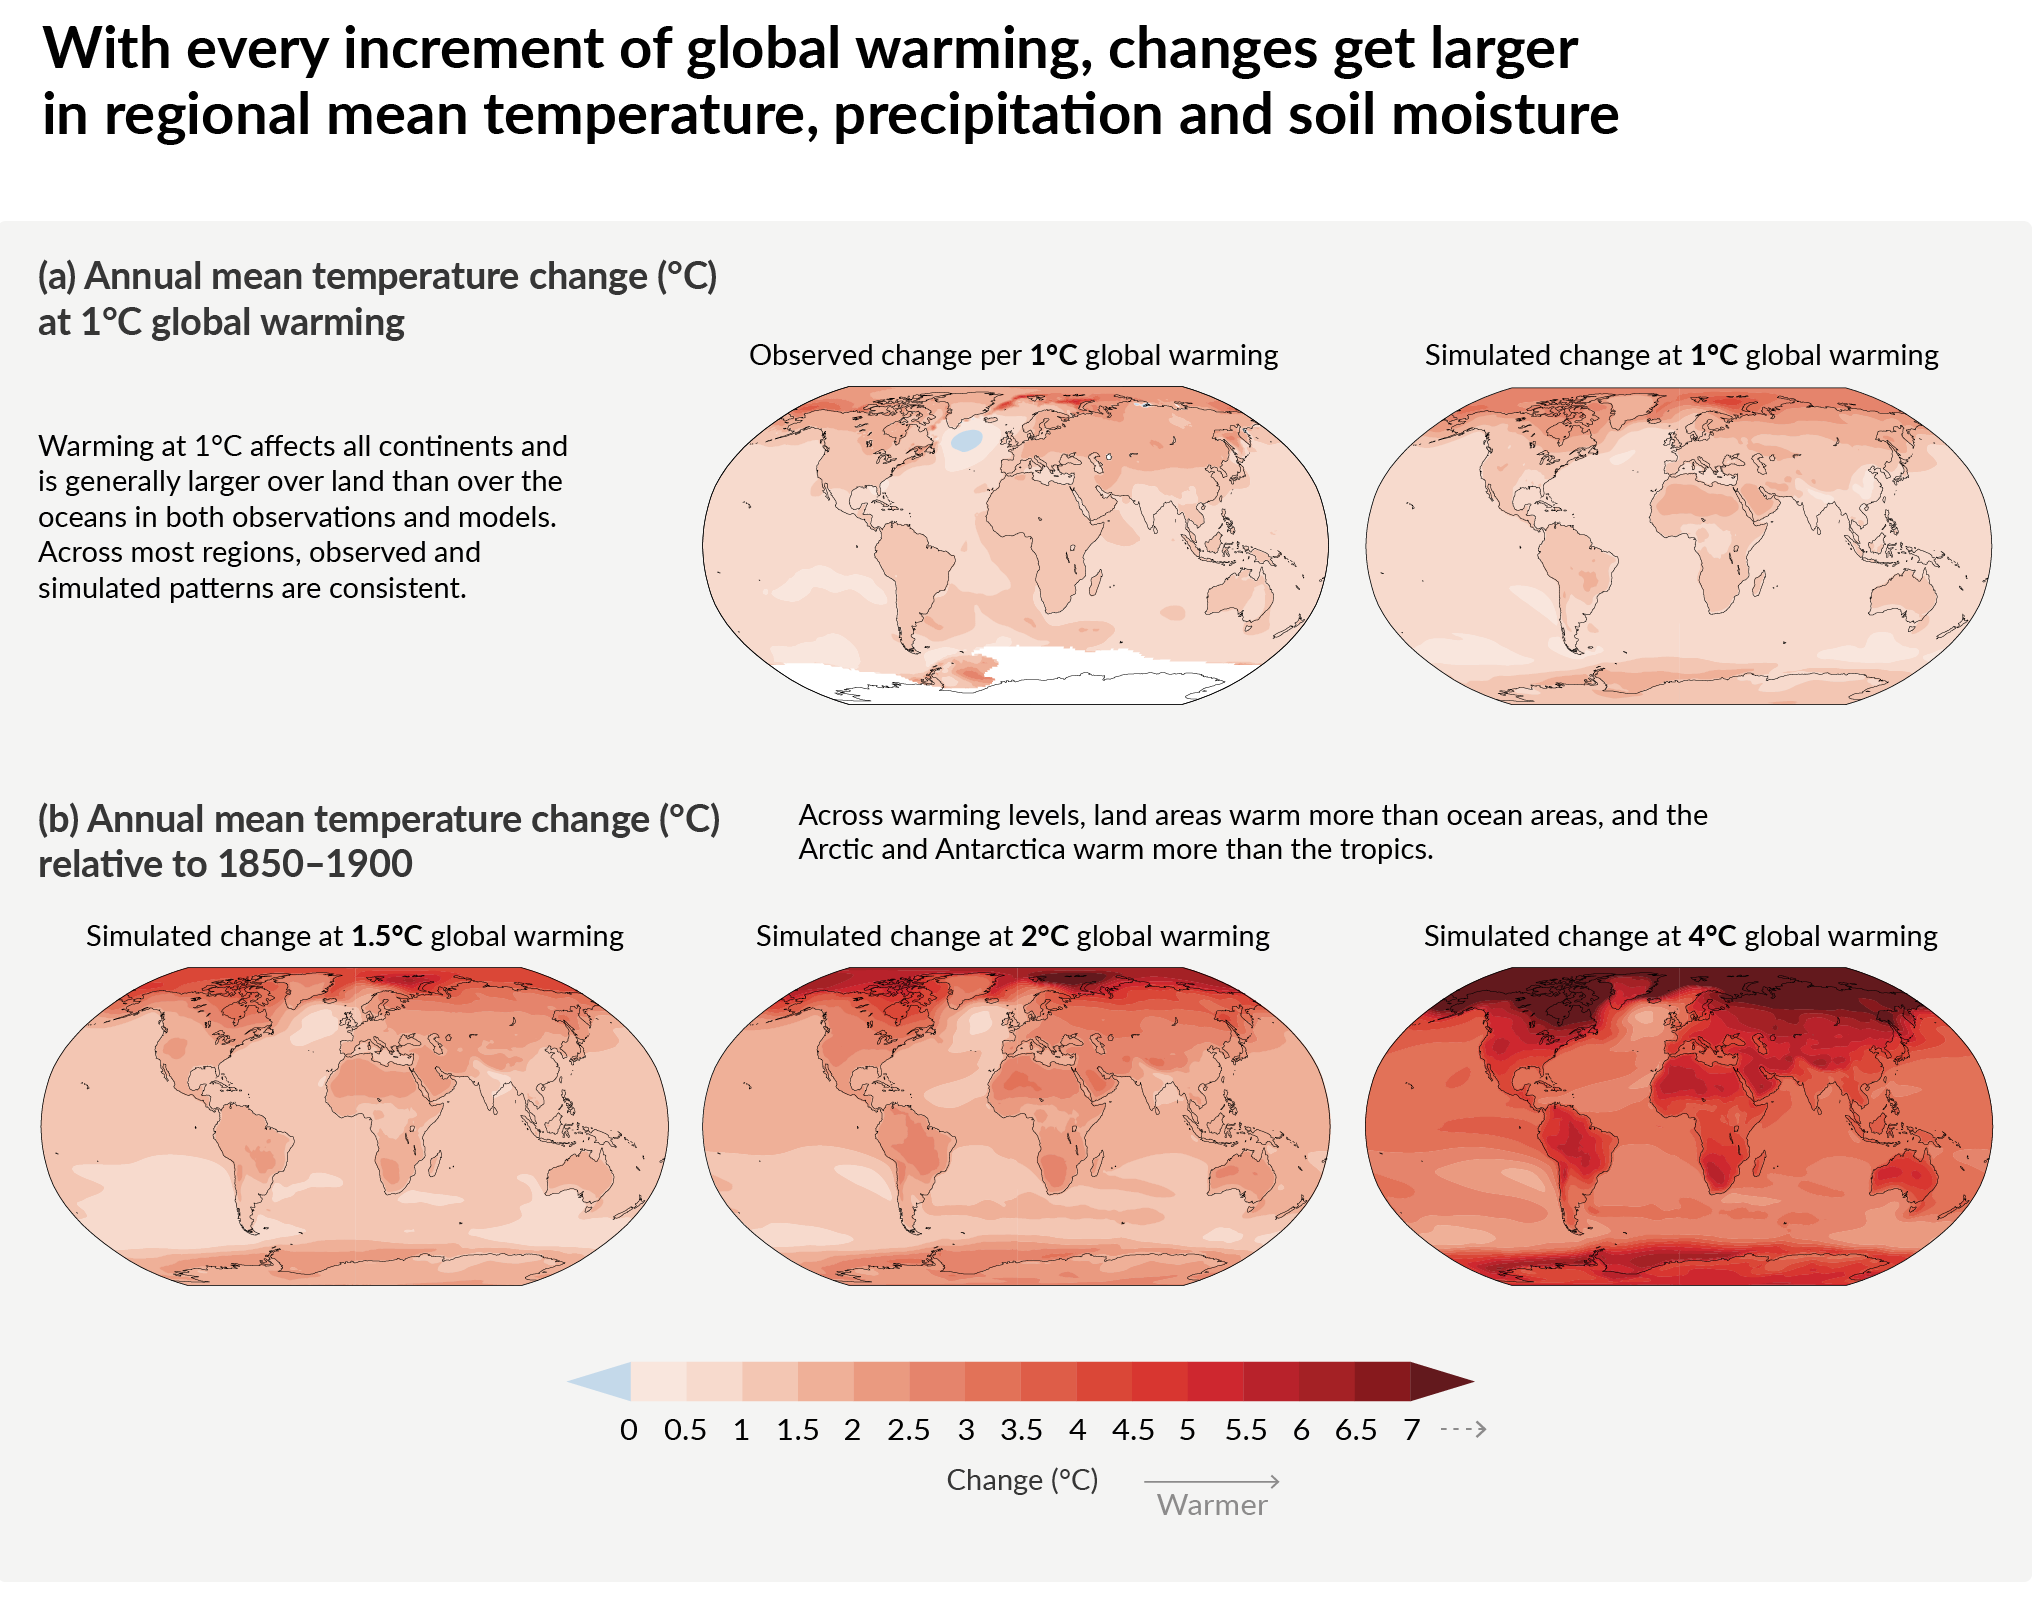
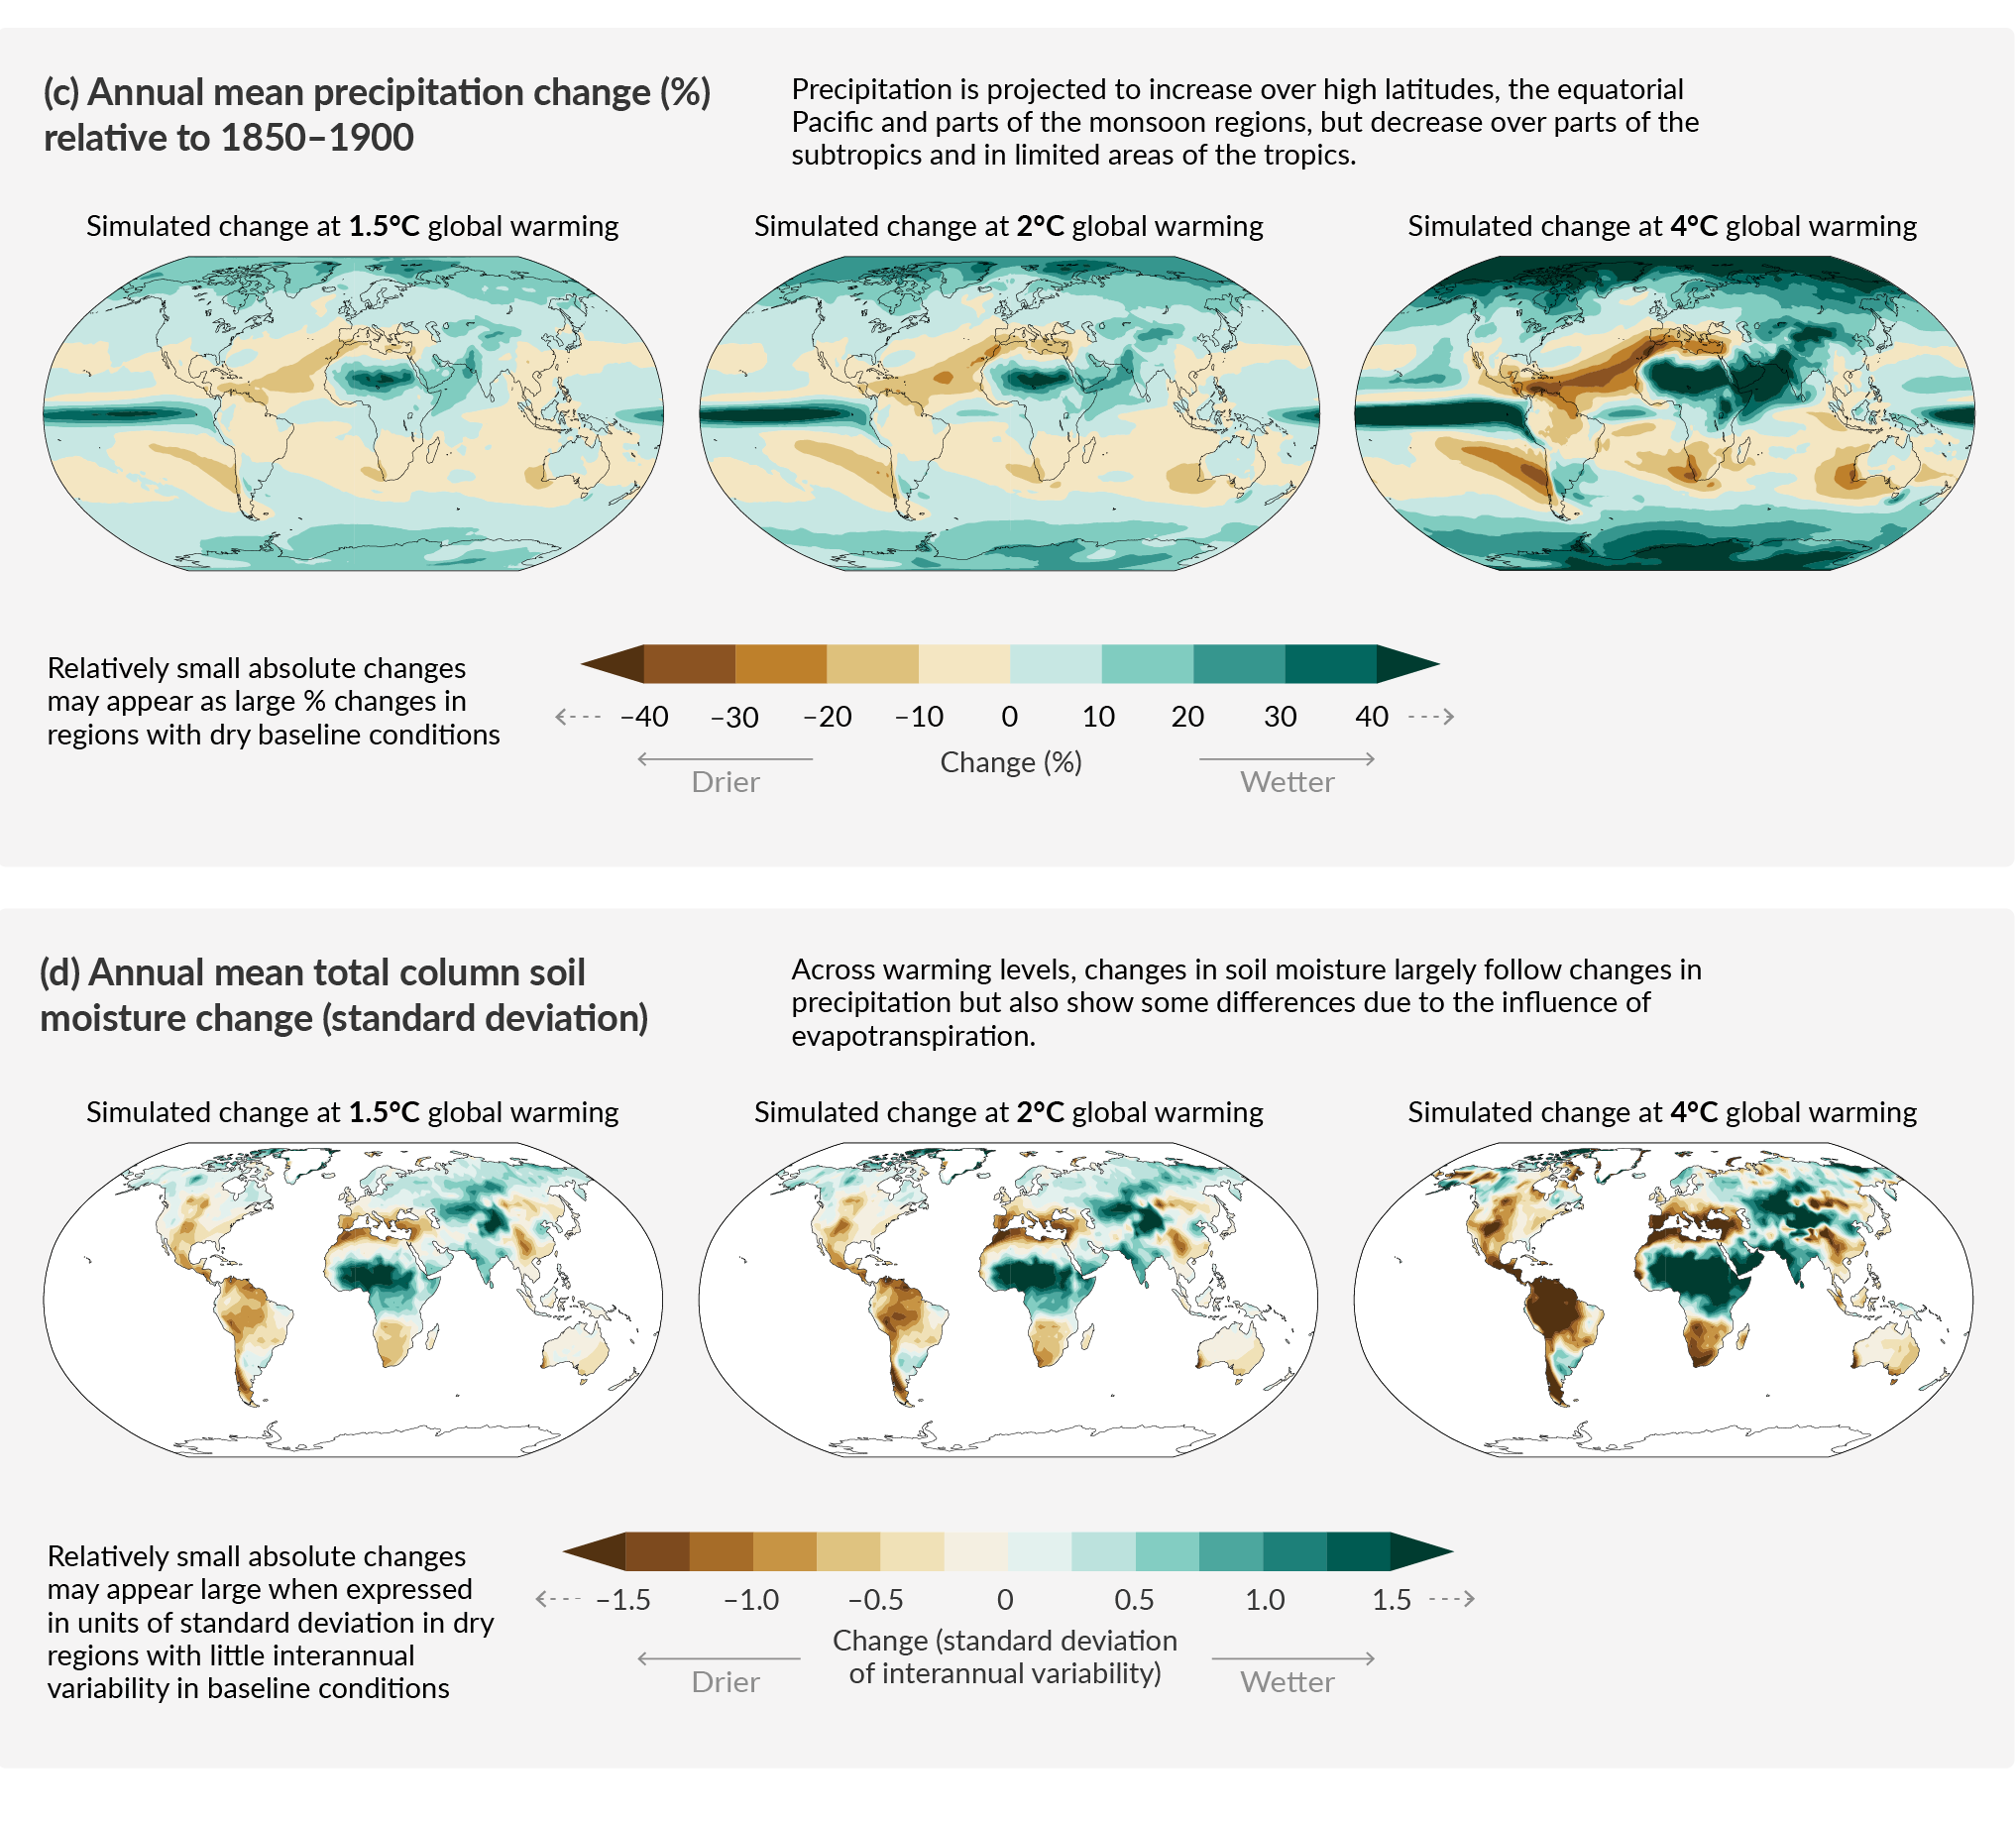
Figure caption
Panel (a) Comparison of observed and simulated annual mean surface temperature change. The left map shows the observed changes in annual mean surface temperature in the period 1850–2020 per °C of global warming (°C). The local (i.e., grid point) observed annual mean surface temperature changes are linearly regressed against the global surface temperature in the period 1850–2020. Observed temperature data are from Berkeley Earth, the dataset with the largest coverage and highest horizontal resolution. Linear regression is applied to all years for which data at the corresponding grid point is available. The regression method was used to take into account the complete observational time series and thereby reduce the role of internal variability at the grid point level. White indicates areas where time coverage was 100 years or less and thereby too short to calculate a reliable linear regression. The right map is based on model simulations and shows change in annual multi-model mean simulated temperatures at a global warming level of 1°C (20-year mean global surface temperature change relative to 1850–1900). The triangles at each end of the colour bar indicate out-of-bound values, that is, values above or below the given limits.
Panel (b) Simulated annual mean temperature change (°C), panel (c) precipitation change (%), and panel (d) total column soil moisture change (standard deviation of interannual variability) at global warming levels of 1.5°C, 2°C and 4°C (20-year mean global surface temperature change relative to 1850–1900). Simulated changes correspond to Coupled Model Intercomparison Project Phase 6 (CMIP6) multi-model mean change (median change for soil moisture) at the corresponding global warming level, that is, the same method as for the right map in panel (a).
In panel (c), high positive percentage changes in dry regions may correspond to small absolute changes. In panel (d), the unit is the standard deviation of interannual variability in soil moisture during 1850–1900. Standard deviation is a widely used metric in characterizing drought severity. A projected reduction in mean soil moisture by one standard deviation corresponds to soil moisture conditions typical of droughts that occurred about once every six years during 1850–1900. In panel (d), large changes in dry regions with little interannual variability in the baseline conditions can correspond to small absolute change. The triangles at each end of the colour bars indicate out-of-bound values, that is, values above or below the given limits. Results from all models reaching the corresponding warming level in any of the five illustrative scenarios (SSP1-1.9, SSP1-2.6, SSP2-4.5, SSP3-7.0 and SSP5-8.5) are averaged. Maps of annual mean temperature and precipitation changes at a global warming level of 3°C are available in Figure 4.31 and Figure 4.32 in Section 4.6. Corresponding maps of panels (b), (c) and (d), including hatching to indicate the level of model agreement at grid-cell level, are found in Figures 4.31, 4.32 and 11.19, respectively; as highlighted in Cross-Chapter Box Atlas.1, grid-cell level hatching is not informative for larger spatial scales (e.g., over AR6 reference regions) where the aggregated signals are less affected by small-scale variability, leading to an increase in robustness. {Figure 1.14, 4.6.1, Cross-Chapter Box 11.1, Cross-Chapter Box Atlas.1, TS.1.3.2, Figures TS.3 and TS.5}